Download
1 / 23
230 likes | 340 Views
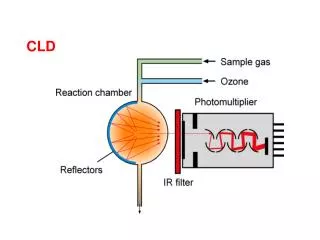
Integrated CLD of the Auckland Region. Created by Hendrik Stouten Ecological Economics Research New Zealand. Population. +. Relative attractiveness Auckland Region. R1. +. +. Residential Growth. Housing.

E N D
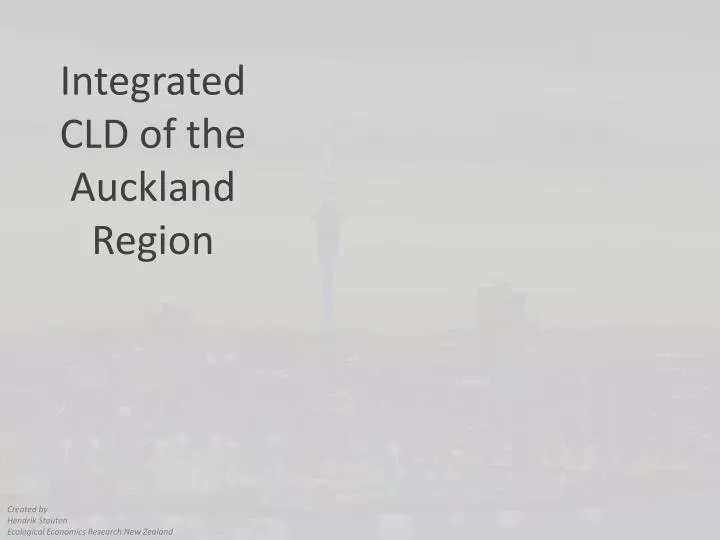
Integrated CLD of the Auckland Region Created by Hendrik Stouten Ecological Economics Research New Zealand
Population + Relative attractiveness Auckland Region R1 + + Residential Growth Housing A first loop that can be identified in the Auckland Region is related to housing. It captures a reinforcing residential growth loop indicating that more (less) housing leads to a more (less) attractive region and therefore to more (less) people requesting more (less) housing.
Population + Relative attractiveness Auckland Region R1 + + Residential Growth + Housing Economic Growth + R2 Economic Activity (GDP) A second loop is an economic growth loop. It is an reinforcing loop that assumes that more (less) economic activity in the region will increase (decrease) its attractiveness resulting in more (less) people entering the region.
Population + Relative attractiveness Auckland Region R1 + + + Residential Growth + Housing Well-being (GPI) Economic Growth + R3 + R2 Economic Activity (GDP) Well-being Drives Growth Economic activity also creates well-being. More well-being makes a region more attractive. Hence, another reinforcing loop is established.
Well-being Saves Lives + Population + R4 Relative attractiveness Auckland Region R1 + + + Residential Growth + Housing Well-being (GPI) Economic Growth + R3 + R2 Well-being does not only affect the population through the attractiveness of the region. It also directly impacts population as higher (lower) degrees of well-being results in more (less) people staying alive. Wellness saves lives and therefore contributes to growth. Economic Activity (GDP) Well-being Drives Growth
Well-being Saves Lives + Population + R4 Relative attractiveness Auckland Region R1 + + + Residential Growth + Housing Well-being (GPI) Economic Growth + + R3 + R2 Economic Activity (GDP) Well-being Drives Growth Education Drives Well-being R5 Employment Next, education is an important factor influencing the attractiveness of a region. Education results in skills and this positively affects employment. Employment in turn results in well-being that feeds into attractiveness. Education is therefore an important driver for growth in a region. + Skills + + Education
Well-being Saves Lives + Population + R4 Relative attractiveness Auckland Region R1 + + + Residential Growth + Housing Well-being (GPI) Economic Growth + + R3 + R2 Economic Activity (GDP) Well-being Drives Growth + Education Drives Well-being R5 R6 Improving Workforce through Education Employment + Education does not only affects well-being, it also affects economic activity as it trains the workforce to better perform such economic activities. Skills + + Education
Well-being Saves Lives + Population + R4 Relative attractiveness Auckland Region R1 + + + Residential Growth + Housing Well-being (GPI) Economic Growth + + R3 + R2 Economic Activity (GDP) Well-being Drives Growth + + Education Drives Well-being Innovation R5 R6 + Improving Workforce through Education Employment Improved skills also accelerates innovation which boosts economic activity. + R7 Skills + Innovation Drives Economic Growth + Education
Well-being Saves Lives + Population + R4 Relative attractiveness Auckland Region R1 + + + Residential Growth + Housing Well-being (GPI) Economic Growth + + + R3 + R2 Economic Activity (GDP) Well-being Drives Growth + + Education Drives Well-being Innovation R5 R6 + Improving Workforce through Education Employment + R7 Skills + Innovation Drives Economic Growth R8 Education Improves Well-being + Education Next, education is also a third factor directly influencing well-being. It is assumed that more (less) education directly results in more (less) well-being.
Well-being Saves Lives + Population + R4 Relative attractiveness Auckland Region R1 + + + Residential Growth + Housing Well-being (GPI) Economic Growth + + + + R3 + R2 Economic Activity (GDP) Well-being Drives Growth + + Education Drives Well-being Innovation R5 R6 + Improving Workforce through Education Health Employment + + R7 R9 Skills + Education Contributes to Improved Health Innovation Drives Economic Growth R8 Education Improves Well-being + Education Finally, education also indirectly influences well-being through health. Education contributes to improved health in the region.
Well-being Saves Lives + Population + R4 Relative attractiveness Auckland Region R1 + + + Residential Growth + Housing Well-being (GPI) Economic Growth + + + + R3 + R2 Economic Activity (GDP) Well-being Drives Growth + + R10 Education Drives Well-being Health Through Housing Innovation R5 R6 + Improving Workforce through Education + Health Employment + + R7 R9 Skills + Education Contributes to Improved Health Innovation Drives Economic Growth R8 Education Improves Well-being + Education Health is also affected by housing.
Well-being Saves Lives + Population + R4 Relative attractiveness Auckland Region R1 + + + + Residential Growth + Transport Infrastructure (Public and Private) Housing Well-being (GPI) Economic Growth + + + + R3 + R2 Economic Activity (GDP) Well-being Drives Growth + + R10 Education Drives Well-being Health Through Housing Innovation R5 R6 + Improving Workforce through Education + Health Employment + + + R7 R9 Skills + Education Contributes to Improved Health Innovation Drives Economic Growth R8 Education Improves Well-being + + Education Accessibility R11 Next, transport and access is added to the causal loop diagram. Public and private transport infrastructure create access to health services reinforcing health and well-being! Growth Through Health Access
Well-being Saves Lives + Population + R4 Relative attractiveness Auckland Region R1 + + + + Residential Growth + Transport Infrastructure (Public and Private) Housing Well-being (GPI) Economic Growth + + + + R3 + R2 Economic Activity (GDP) Well-being Drives Growth + + R10 Education Drives Well-being Health Through Housing Innovation R5 R6 + Improving Workforce through Education + Health Employment + + + R7 R9 Skills + Education Contributes to Improved Health Public and private transport infrastructure also provides access to education reinforcing the growth-loops related to education Innovation Drives Economic Growth R8 Education Improves Well-being R12 + + Growth Through Access to Education Education + Accessibility R11 Growth Through Health Access
Well-being Saves Lives + Population + R4 Relative attractiveness Auckland Region R1 + + + + Residential Growth + Transport Infrastructure (Public and Private) Housing Well-being (GPI) Economic Growth + + + + R3 + R2 Economic Activity (GDP) Well-being Drives Growth + + + R10 Education Drives Well-being Health Through Housing Innovation R5 R6 + Improving Workforce through Education + Health Employment + + + R13 Growth Through Access to Economic Activities by Public and Private transport Finally, public and private transport infrastructure also provides access to economic activities which in turn reinforces growth through economic activities. R7 R9 Skills + Education Contributes to Improved Health Innovation Drives Economic Growth R8 Education Improves Well-being R12 + + Growth Through Access to Education Education + Accessibility R11 Growth Through Health Access
Well-being Saves Lives + Population + R4 Relative attractiveness Auckland Region R1 + + + + Residential Growth + Transport Infrastructure (Public and Private) Housing Well-being (GPI) R14 Economic Growth + + + + R3 + Growth Through Access by Active Mode R2 Economic Activity (GDP) Well-being Drives Growth + + + + R10 Active Mode Infrastructure Education Drives Well-being Health Through Housing Innovation R5 R6 + Improving Workforce through Education + Health Employment + + + R13 Growth Through Access to Economic Activities by Public and Private transport R7 R9 Skills + Education Contributes to Improved Health Innovation Drives Economic Growth R8 Education Improves Well-being R12 + + Growth Through Access to Education Education + + Accessibility R11 However, next to public and private transport infrastructure, a region can also invest in cycling and walking infrastructure (i.e. forms of active mode). This in turn also increases access to education, health and economic activities. Growth Through Health Access
Well-being Saves Lives + Population + R4 Relative attractiveness Auckland Region R1 + + + + Residential Growth + Transport Infrastructure (Public and Private) Housing Well-being (GPI) R14 Economic Growth + + + + R3 + Growth Through Access by Active Mode R2 Economic Activity (GDP) Well-being Drives Growth + + + + R10 Active Mode Infrastructure Education Drives Well-being Health Through Housing Innovation R5 Moreover, cycling and walking is also healthy and therefore creates well-being and drives the growth in economic activity, education etc loops. R6 + Improving Workforce through Education + Health Employment + + + + R13 Growth Through Access to Economic Activities by Public and Private transport R7 R9 Skills + Education Contributes to Improved Health Innovation Drives Economic Growth R8 Education Improves Well-being R15 R12 + + Being Active is Healthy and Drives Growth Growth Through Access to Education Education + + Accessibility R11 Growth Through Health Access
Well-being Saves Lives + Population + R4 Relative attractiveness Auckland Region R1 + + + + Residential Growth + Transport Infrastructure (Public and Private) Housing Well-being (GPI) R14 Economic Growth + + + + R3 + Growth Through Access by Active Mode R2 Economic Activity (GDP) So far, we have identified reinforcing loops. However, nothing can grow forever. Hence, balancing loops need to be identified. A first balancing loop relates economic activity to natural capital as natural capital puts limits to economic activities. Well-being Drives Growth + + + + + B1 R10 Active Mode Infrastructure Education Drives Well-being Natural limits to Economic Growth Health Through Housing - Innovation R5 R6 Natural Capital + Improving Workforce through Education + Health Employment + + + + R13 Growth Through Access to Economic Activities by Public and Private transport R7 R9 Skills + Education Contributes to Improved Health Innovation Drives Economic Growth R8 Education Improves Well-being R15 R12 + + Being Active is Healthy and Drives Growth Growth Through Access to Education Education + + Accessibility R11 Growth Through Health Access
Well-being Saves Lives Natural Capital also limits well-being as more (less) health leads to more (less) people and therefore more (less) economic activity resulting in less (more) natural capital and less (more) health. + Population + R4 Relative attractiveness Auckland Region R1 + + + + Residential Growth + Transport Infrastructure (Public and Private) Housing Well-being (GPI) R14 Economic Growth + + + + R3 + Growth Through Access by Active Mode R2 B2 Economic Activity (GDP) Well-being Drives Growth Natural Limits To Wellness Caused by Growth Affecting Health + + + + + B1 R10 Active Mode Infrastructure Education Drives Well-being Natural limits to Economic Growth Health Through Housing - Innovation R5 R6 Natural Capital + Improving Workforce through Education + Health Employment + + + + + R13 Growth Through Access to Economic Activities by Public and Private transport R7 R9 Skills + Education Contributes to Improved Health Innovation Drives Economic Growth R8 Education Improves Well-being R15 R12 + + Being Active is Healthy and Drives Growth Growth Through Access to Education Education + + Accessibility R11 Growth Through Health Access
Well-being Saves Lives Natural Capital also limits economic activity as more (less) health leads to more (less) employment and therefore more (less) economic activity resulting in less (more) natural capital and less (more) health + Population + R4 Relative attractiveness Auckland Region R1 + + + + Residential Growth + Transport Infrastructure (Public and Private) Housing Well-being (GPI) R14 Economic Growth + + + + R3 + Growth Through Access by Active Mode R2 B2 Economic Activity (GDP) Well-being Drives Growth Natural Limits To Wellness Caused by Growth Affecting Health + + + + + B1 R10 Active Mode Infrastructure Education Drives Well-being Natural limits to Economic Growth Health Through Housing - B3 Innovation R5 R6 Natural Capital + Natural Limits To Employment Caused by Growth Affecting Health + Improving Workforce through Education + Health Employment + + + + + R13 Growth Through Access to Economic Activities by Public and Private transport R7 R9 Skills + Education Contributes to Improved Health Innovation Drives Economic Growth R8 Education Improves Well-being R15 R12 + + Being Active is Healthy and Drives Growth Growth Through Access to Education Education + + Accessibility R11 Growth Through Health Access
Well-being Saves Lives + Population + R4 Relative attractiveness Auckland Region R1 Stress Increases the Natural Limits To Growth + + + + Residential Growth + Transport Infrastructure (Public and Private) Housing Well-being (GPI) B4 R14 Economic Growth + + + + R3 + Growth Through Access by Active Mode R2 + B2 Economic Activity (GDP) Well-being Drives Growth Natural Limits To Wellness Caused by Growth Affecting Health Impervious Area + + + + + B1 R10 Active Mode Infrastructure Education Drives Well-being Natural limits to Economic Growth Health Through Housing - - Next, there are also important balancing loops related to transport. As public and private transport infrastructure increases (decreases) so does impervious area. This will negatively (positively) affect natural capital and therefore reduce (increase) well-being through reducing (increasing) health. B3 Innovation R5 R6 Natural Capital + Natural Limits To Employment Caused by Growth Affecting Health + Improving Workforce through Education + Health Employment + + + + + R13 Growth Through Access to Economic Activities by Public and Private transport R7 R9 Skills + Education Contributes to Improved Health Innovation Drives Economic Growth R8 Education Improves Well-being R15 R12 + + Being Active is Healthy and Drives Growth Growth Through Access to Education Education + + Accessibility R11 Growth Through Health Access
Well-being Saves Lives + Population + R4 Relative attractiveness Auckland Region R1 Stress Increases the Natural Limits To Growth + + + + Residential Growth + Transport Infrastructure (Public and Private) Housing Well-being (GPI) A final balancing loop is related to emissions resulting from public and private transport. More (less) emissions result in lesser (more) health and therefore reduces (increases) well-being. Hence, emissions therefore mainly limits the growth loops due to reduced health and therefore well-being. B4 R14 Economic Growth + + + + R3 + Growth Through Access by Active Mode R2 + B2 Economic Activity (GDP) Well-being Drives Growth Natural Limits To Wellness Caused by Growth Affecting Health Impervious Area + + + + + B1 R10 Active Mode Infrastructure Education Drives Well-being Natural limits to Economic Growth Health Through Housing - - B3 Innovation R5 + R6 Natural Capital + Natural Limits To Employment Caused by Growth Affecting Health Emissions + Improving Workforce through Education + Health Employment + + + + B5 - + R13 Unhealthy Emissions Limits Growth Growth Through Access to Economic Activities by Public and Private transport R7 R9 Skills + Education Contributes to Improved Health Innovation Drives Economic Growth R8 Education Improves Well-being R15 R12 + + Being Active is Healthy and Drives Growth Growth Through Access to Education Education + + Accessibility R11 Growth Through Health Access
Well-being Saves Lives + Population + R4 Relative attractiveness Auckland Region R1 Stress Increases the Natural Limits To Growth + + + + Residential Growth + Transport Infrastructure (Public and Private) Housing Well-being (GPI) B4 R14 Economic Growth + + + + R3 + Growth Through Access by Active Mode R2 + B2 Economic Activity (GDP) Well-being Drives Growth Natural Limits To Wellness Caused by Growth Affecting Health Impervious Area + + + + + B1 R10 Active Mode Infrastructure Education Drives Well-being Natural limits to Economic Growth Health Through Housing - - B3 Innovation R5 + R6 Natural Capital + Natural Limits To Employment Caused by Growth Affecting Health Emissions + Improving Workforce through Education + Health Employment + + + + B5 - + R13 Unhealthy Emissions Limits Growth Growth Through Access to Economic Activities by Public and Private transport R7 R9 Skills + Education Contributes to Improved Health Innovation Drives Economic Growth R8 Education Improves Well-being R15 R12 + + Being Active is Healthy and Drives Growth Growth Through Access to Education Education + + Accessibility R11 Growth Through Health Access THE END!
Well-being Saves Lives + Population + R4 Relative attractiveness Auckland Region R1 Stress Increases the Natural Limits To Growth + + + + Residential Growth + Transport Infrastructure (Public and Private) Housing Well-being (GPI) B4 R14 Economic Growth + + + + R3 + Growth Through Access by Active Mode R2 + B2 Economic Activity (GDP) Well-being Drives Growth Natural Limits To Wellness Caused by Growth Affecting Health Impervious Area + + + + + B1 R10 Active Mode Infrastructure Education Drives Well-being Natural limits to Economic Growth Health Through Housing - - B3 Innovation R5 + R6 Natural Capital + Natural Limits To Employment Caused by Growth Affecting Health Emissions + Improving Workforce through Education + Health Employment + + + + B5 - + R13 Unhealthy Emissions Limits Growth Growth Through Access to Economic Activities by Public and Private transport R7 R9 Skills + Education Contributes to Improved Health Innovation Drives Economic Growth R8 Education Improves Well-being R15 R12 + + Being Active is Healthy and Drives Growth Growth Through Access to Education Education + + Accessibility R11 Growth Through Health Access Created by Hendrik Stouten Ecological Economics Research New Zealand