Download
1 / 13
140 likes | 1.01k Views
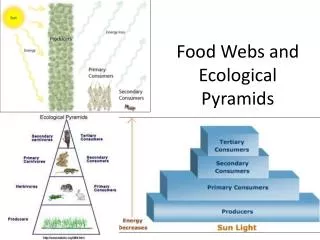
ECOLOGICAL PYRAMIDS. Ecological Pyramids. An ecological pyramid is a diagram that shows the relationship amounts of energy or matter contained within each trophic level in a food web or food chain.

E N D
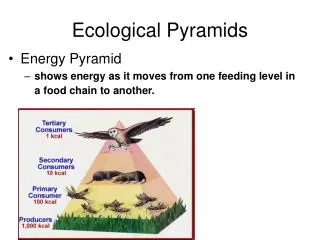
Ecological Pyramids An ecological pyramid is a diagram that shows the relationship amounts of energy or matter contained within each trophic level in a food web or food chain. Energy Pyramid only 10% of the energy available within one trophic level is transferred to organisms at the next trophic level.
Pyramids Continued • Biomass pyramids show the total amount of living tissue available at each trophic level. This shows the amount of tissue available for the next trophic level. • Numbers pyramid shows the number of species at each trophic level. • Because each trophic level harvests only about one tenth of the energy from the level below, it can support only about one 10th the amount of living tissue.
Feeding Relationships • Energy flow through an ecosystem in one direction, from the sun or inorganic compounds to autotrophs (producers) and then to various heterotrophs (consumers). • Food Chains are a series of steps in which organisms transfer energy by eating or being eaten. • Food webs show the complex interactions within an ecosystem. • Each step in a food chain or web is called a trophic level. Producers make up the first step, consumers make up the higher levels.
ECOLOGICAL PYRAMIDS Food chains and food webs do not give any information about the numbers of organisms involved. This information can be shown through ecological pyramids.
PYRAMID OF NUMBERS • Shows the number of organisms at each trophic level per unit area of an ecosystem.
Pyramid of Numbers Pyramid of numbers displays the number of individuals at each level. 1 owl 25 voles 2000 grass plants
PYRAMID OF BIOMASS • The total amount of matter present in organisms of an ecosystem at each trophic level is biomass. • Biomass is preferred to the use of numbers of organisms because individual organisms can vary in size. It is the total mass not the size that is important. • Pyramid of biomass records the total dry organic matter of organisms at each trophic level in a given area of an ecosystem.
Biomass Pyramids Displays the biomass at each trophic level.
Shows the amount of energy input to each trophic level in a given area of an ecosystem over an extended period. • Why will this type of pyramid never be inverted? PYRAMID OF ENERGY
Energy Pyramid In nature, ecological efficiency varies from 5% to 20% energy available between successive trophic levels (95% to 80% loss). About 10% efficiency is a general rule. Fig. 4–19
Another Energy Pyramid Annual pyramid of energy flow (in kilocalories per square meter per year) for an aquatic ecosystem in Silver Springs, FL. Note: More individuals can be supported at lower trophic levels. Less energy is lost.
Cycles of Matter • Unlike the one-way flow of energy, matter is recycled within and between ecosystems. • These cycles are the water cycle, Nutrient Cycle, Carbon Cycle, nitrogen cycle and phosphorus cycle.