Download
1 / 44
440 likes | 645 Views
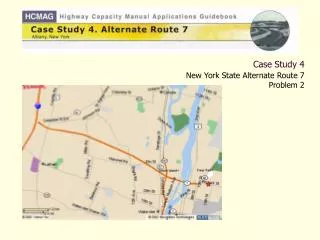
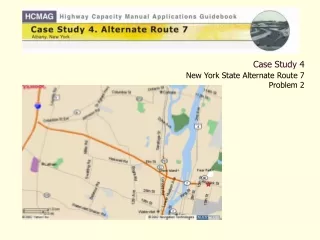
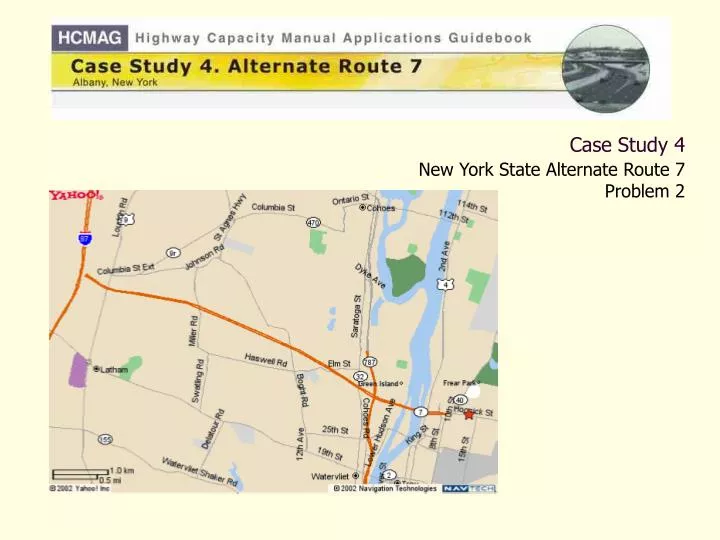
Case Study 4 New York State Alternate Route 7 Problem 2. Problem 2. Operational analysis of the I-87/Alternate Route 7 Interchange. Problem 2. Sub-problem 2a. What types of analysis should be conducted?

E N D
Problem 2 Operational analysis of the I-87/Alternate Route 7 Interchange
Problem 2 Sub-problem 2a. What types of analysis should be conducted? Sub-problem 2b. What are the levels of service in the weaving sections (points A, B, and C)? Sub-problem 2c.What are the levels of service along the ramp and at the ramp junction for the on-ramp from Alternate Route 7 to I-87 northbound (point D)? Sub-problem 2d. What is the effect of making geometric improvements to the ramp and at the ramp junction for the on-ramp from Alternate Route 7 to I-87 northbound?
Problem 2a Observations? What segments do you think should be analyzed and what facility types do they represent?
Problem 2a Observations? • Ramp junctions?
Problem 2a • Possible ramp junctions • westbound Alternate Route 7 exit ramp to I-87 northbound • westbound Alternate Route 7 exit ramp to U.S. 9 • westbound Alternate Route 7 entrance ramp from U.S. 9 • eastbound Alternate Route 7 entrance ramp from I-87 northbound • eastbound Alternate Route 7 exit ramp to U.S. 9 • eastbound Alternate Route 7 entrance ramp from Alternate Route 7 • southbound I-87 exit ramp to frontage road • southbound I-87 frontage road exit ramp to Alternate Route 7 • southbound I-87 frontage road entrance ramp from Alternate Route 7 • southbound I-87 frontage road exit to I-87 southbound mainline • southbound I-87 entrance ramp from southbound I-87 frontage road • northbound I-87 entrance ramp from State Route 2 and 7 • northbound I-87 exit ramp to eastbound Alternate Route 7 • northbound I-87 entrance ramp from westbound Alternate Route 7 • entrance ramp on I-87 entrance ramp from U.S. 9 • entrance ramp from U.S. 9 to westbound Alternate Route 7 ramp
Problem 2a • True freeway merge or diverge points • Westbound Alternate Route 7 exit ramp to I-87 northbound (including both a diverge point from Alternate Route 7 and a merge point onto I-87) • Eastbound Alternate Route 7 on-ramp from U.S. 9 (this is a merge point) • Southbound I-87 entrance ramp from southbound I-87 frontage road (this is also a merge point)
Problem 2b Observations? • Weaving sections?
Problem 2b • Questions to consider: • What type of analysis will produce an evaluation of traffic conditions present at the weaving sections? • What data are needed to analyze the operations of these weaving sections? • What are the limitations of the models used to analyze the performance of a weaving section? • Why are these weaving sections considered to be Type A weaves? • What measures of effectiveness are used to evaluate the performance of a weaving section? • What is meant by the terms "constrained operation" and "unconstrained operation?"
Problem 2b • What type of analysis will produce an evaluation of traffic conditions present at the weaving sections? • Operational analysis • Design analysis
Problem 2b • What data are needed to analyze the operations of these weaving sections? • the freeway free-flow speed • the number of lanes in the weaving section • the length of the weaving section • the terrain topography (level or rolling) • the configuration (type) of the weaving section • the weaving volumes • the peak hour factor • the percentage of heavy vehicles present in the traffic stream
Problem 2b • What are the limitations of the models used to analyze the performance of a weaving section? • Vw, or the total weaving volume in the section, must be less than 2,800 pc/hr for Type A weaves, for example • The flow rate through the weaving section must be less than that allowable for a basic freeway segment. • VR, or the proportion of the total flow that is weaving, must be less than 0.45 for a three-lane section and 0.35 for a four-lane section. • The total length of the weaving section must be less than 2,500 feet, or the section should be considered only as unconnected merge and diverge (ramp junctions) points.
Problem 2b • Why are these weaving sections considered to be Type A weaves? • Each weaving traffic stream must make one lane change to reach its desired destination
Problem 2b • What measures of effectiveness are used to evaluate the performance of a weaving section? • Traffic density
Problem 2b • What is meant by the terms "constrained operation" and "unconstrained operation?" • The number of lanes that must be used by weaving vehicles to achieve equilibrium or unconstrained operation (Nw) and • The maximum number of lanes that can be used by weaving vehicles for a given configuration (Nwmax).
Problem 2b • How will these weaving sections perform, given these inputs? • What parameters do we use to characterize the performance of the weaving sections?
Problem 2b Observations?
Problem 2b • How does the length of each weaving section affect its operation? • The volume ratio, VR, is more than twice as high in Weaves B and C as in Weave A; is this significant and if so, why? • What is the significance of the predicted speeds for the weaving and non-weaving traffic? The weaving speeds are approximately 16 to 18 mi/hr less than the non-weaving speeds for five of the time periods presented in the table; is this important and if so, why? • Why is the weaving traffic constrained? What is the practical implication of this finding? • What happens when the weaving flow rate exceeds the model limit? • In Weaves A and B, the volume ratio, VR, exceeds the model limit; what is the likely result that you would observe in the field?
Problem 2b Observations? • As you consider the data, how would you summarize the operations of the weaving sections in this interchange?
Problem 2b • Weave A • LOS A and B • High speed differential between the weaving and non-weaving vehicles, but proportion of weaving traffic (volume ratio) is low (0.31 and 0.30, respectively) during the two time periods: overall speed of all vehicles in the section is over 50 mi/hr and the resultant densities (9.4 pc/mi/lane and 12.5 pc/mi/lane) are low • Weave A will operate at acceptable level; no reason to consider changes to the design • All model limitations are met, so we can be reasonably confidant of our conclusions
Problem 2b • Weave B • LOS B and E • Very high volume ratio (VR) during both periods, but lower total volumes mitigate this condition in AM. • In PM , high volume ratio combined with the high overall flow rates result in an overall speed of 31.7 mi/hr in the weaving section and a density of 38.2 pc/mi/lane • Volume ratio and total weaving volume model limits are exceeded during PM resulting in a breakdown of operations and queuing at some locations. • Volume ratio limit exceeded in AM, again resulting in poor operations. • Conclusion: even though the forecasted LOS is B for the AM peak, both time periods will experience poor operations with breakdowns in flow to be expected
Problem 2b • Weave C • LOS E and F • With high density and the failing conditions we should consider another tool in addition to the HCM, such as a microscopic simulation model, to evaluate this weaving section
Problem 2c • Should we consider only the vicinity of the junction itself, or are there other areas that we should consider as well? • What input data are needed to conduct this analysis? • What is the primary measure of effectiveness for a merge point analysis? • What parameters are forecasted by the merge point analysis models in the HCM? • What are some of the limitations of the merge point analysis model that we must keep in mind when applying it to this sub-problem?
Problem 2c • Should we consider only the vicinity of the junction itself, or are there other areas that we should consider as well? • Merge influence area • Merge with US 9 ramp • Capacity of ramps
Problem 2c • What input data are needed to conduct this analysis? • number of lanes on the freeway • free flow speed on the freeway • freeway volume just upstream of the merge point • free flow speed of the ramp • ramp volume • number of lanes on the ramp • length of the acceleration lane(s)
Problem 2c • What is the primary measure of effectiveness for a merge point analysis? • Density (expressed in terms of vehicles per mile per lane)
Problem 2c • What parameters are forecasted by the merge point analysis models in the HCM? • flow rate in the merge influence area • density in the merge area • level of service • speed
Problem 2c • What are some of the limitations of the merge point analysis model that we must keep in mind when applying it to this sub-problem? • it does not apply when demand exceeds capacity • If demand exceeds capacity, we need to consider another procedure, possibly microscopic simulation
Problem 2c • What is the significance of the parameter, PFM? • Which data from the table above describe the nature of the flow of traffic in the merge influence area? • What is the basis for the forecast of level of service? • How would you describe the operation of the merge point in the PM peak period?
Problem 2c • What is the significance of the parameter, PFM? • Important function of the merge point analysis: estimate the lane distribution of traffic in the vicinity of the merge point • PFM: proportion of the approaching freeway flow remaining in lanes 1 and 2 immediately upstream of the merge point • PFM depends on number of lanes on the freeway mainline and length of the acceleration lane from the ramp to the mainline. • PFM = 0.59; 59 percent of the approaching freeway flow remains in lanes 1 and 2 immediately upstream of the merge point • If the freeway had more lanes at this point, this value would be lower, as more of the mainline traffic would avoid the turbulence of the merge area
Problem 2c • Which data from the table above describe the nature of the flow of traffic in the merge influence area? • Flow rate in the merge influence area (vR12) is compared to the capacity of the area to determine whether this area is under capacity or over capacity • During PM, vR12 exceeds the capacity of the merge influence area • significant part of the demand (5,264 - 4,600 = 664) can't be served during the analysis period • unserved demand is diverted to the next analysis period
Problem 2c • What is the basis for the forecast of level of service? • Density is used to determine level of service • PM peak, 42.4 pc/mi/lane (LOS F) • AM peak, 13.7 pc/mi/lane (LOS B)
Problem 2c • How would you describe the operation of the merge point in the PM peak period? • Operation of the merge point during PM peak period is poor • Demand exceeds capacity, the density is high, and the speed is relatively low • Since the demand exceeds capacity, we need to consider another analysis tool, such as a microscopic simulation tool • HCM chapter 25: this methodology does not take into account oversaturated conditions
Problem 2d Observations? • How can we improve the level of service at the ramp junction at the northbound on-ramp to I-87? • Variables of prime importance • Free flow speed on the ramp • Free flow speed on the mainline • Number of lanes on the ramp • Number of lanes on the mainline • Length of the acceleration lane in the merge area • What possible design changes would you suggest to mitigate the problem at the ramp junction?
Problem 2d • What possible design changes would you suggest to mitigate the problem at the ramp junction? • adding a lane to the freeway mainline • adding a lane to the ramp • lengthening the acceleration lane
Problem 2d • Adding a lane to the freeway mainline • What is the most significant change in the performance of the merge area as a result of the addition of the lane to the freeway mainline? • Does the addition of the lane produce acceptable performance of the merge area?
Problem 2d • Adding a lane to the freeway mainline • What is the most significant change in the performance of the merge area as a result of the addition of the lane to the freeway mainline? • Does the addition of the lane produce acceptable performance of the merge area?
Problem 2d • Adding a lane to the ramp • What is the most significant change in the performance of the merge area as a result of the addition of the lane to the freeway mainline? • Does the addition of the lane produce acceptable performance of the merge area?
Problem 2d • Lengthening the acceleration lane
Problem 2 discussion • Discussion points • We don't have results that are completely reliable. • For two of the weaving sections and for the ramp junction, the model boundaries were exceeded, thus putting some uncertainty on the results produced by the HCM analysis. • While we have looked at the components of the interchange, we are still conducting this analysis in some isolation. • How does the operation of the interchange affect the mainline section of I-87, particularly in the vicinity of the various ramp junctions? • How does the interchange affect the operation of Alternate Route 7?