Download

1 / 47
610 likes | 1.3k Views
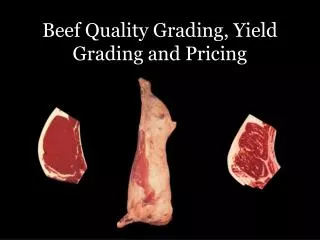
BEEF CARCASS YIELD AND QUALITY GRADING. South Carolina Meat Judging Workshop. USDA Beef Carcass Grades. Purpose: Classify Carcasses Expected Cutability or Retail Yield Expected Eating Quality. Conformation Dictates Composition. USDA Yield Grade.

E N D
BEEF CARCASSYIELD AND QUALITY GRADING South Carolina Meat Judging Workshop
USDA Beef Carcass Grades • Purpose: Classify Carcasses • Expected Cutability or Retail Yield • Expected Eating Quality
Conformation Dictates Composition
USDA Yield Grade • Estimates - % Closely-Trimmed, Boneless Retail Cuts From Chuck, Rib, Loin and Round • Yield Grade 1 > 52.4% • Yield Grade 2 50.0 - 52.3% • Yield Grade 3 47.7 - 50.0% • Yield Grade 4 45.4 - 47.7% • Yield Grade 5 < 45.4%
USDA Yield Grade • 12th Rib Backfat • Ribeye Area • % Kidney, Pelvic, Heart Fat • Hot Carcass Weight
12th Rib Backfat 3/4 of the longitudinal length of the ribeye muscle Avg - .5 in Range - .15 - .80
Ribeye Area Average - 12.8 in2 Range - 10.0 - 18.0 in2
Estimating Ribeye Area • Can estimate length x width • Other references 2.5 x 3.5 = 8.75 in2 About 5.0 in2
Pelvic Kidney Heart % KPH Fat Avg - 2.0%
Hot Carcass Weight Usually Given
USDA Yield Grade • Equation 2.5 + (2.5 x 12th Rib Backfat, in.) - (0.32 x Ribeye Area, sq in.) + (0.20 x KPH Fat, %) + (0.0038 x Hot Carcass Wt, lbs.)
USDA Yield GradeShort-Cut Method • Step 1 • Determine Preliminary Yield Grade
USDA Yield GradeShort-Cut Method • Step 2 • Adjust PYG for REA
USDA Yield GradeShort-Cut Method • Step 3 • Adjust PYG for HCW
USDA Yield GradeShort-Cut Method • Step 4 • Adjust PYG for KPH fat %
USDA Yield GradeShort-Cut Method - Alternate • Step 2 - Combine steps 2 & 3 • Determine Expected REA
USDA Yield GradeShort-Cut Method - Alternate • Step 2 - Combine steps 2 & 3 • Adjust PYG for Expected REA
Practice Calculations Carcass Trait AFOE 0.5 REA 13.6 HCW 825 KPH 3.0 YG Formula
Practice Calculations Carcass Trait AFOE 0.5 3.25 REA 13.6 HCW 825 KPH 3.0 YG Formula
Practice Calculations Carcass Trait AFOE 0.5 3.25 REA 13.6 -0.8 HCW 825 KPH 3.0 YG Formula
Practice Calculations Carcass Trait AFOE 0.5 3.25 REA 13.6 -0.8 HCW 825 +0.9 KPH 3.0 YG Formula
Practice Calculations Carcass Trait AFOE 0.5 3.25 REA 13.6 -0.8 HCW 825 +0.9 KPH 3.0 -0.1 YG Formula
Practice Calculations Carcass Trait AFOE 0.5 3.25 REA 13.6 -0.8 HCW 825 +0.9 KPH 3.0 -0.1 YG 3.25 Formula 3.13
Practice Calculations Carcass Trait AFOE 0.75 REA 12.5 HCW 870 KPH 4.5 YG Formula
Practice Calculations Carcass Trait AFOE 0.75 3.88 REA 12.5 HCW 870 KPH 4.5 YG Formula
Practice Calculations Carcass Trait AFOE 0.75 3.88 REA 12.5 -0.5 HCW 870 KPH 4.5 YG Formula
Practice Calculations Carcass Trait AFOE 0.75 3.88 REA 12.5 -0.5 HCW 870 +1.1 KPH 4.5 YG Formula
Practice Calculations Carcass Trait AFOE 0.75 3.88 REA 12.5 -0.5 HCW 870 +1.1 KPH 4.5 +0.2 YG Formula
Practice Calculations Carcass Trait AFOE 0.75 3.88 REA 12.5 -0.5 HCW 870 +1.1 KPH 4.5 +0.2 YG 4.68 Formula 4.58
USDA Quality Grade • Estimates Eating Characteristics • Tenderness, Juiciness, Flavor • USDA Prime USDA Commercial • USDA Choice USDA Utility • USDA Select USDA Cutter • USDA Standard USDA Canner
Prime Choice Select Standard 8 7 6 5 4 3 2 1 Extremely Undesirable Extremely Desirable Relationship of Quality Gradeand Palatability Smith et al., 1992
USDA Quality Grade • Carcass Maturity/Age • Marbling Score • Lean Color • Lean Texture • Lean Firmness
Carcass Maturity A 9 to 30 months B 30 to 42 months C 42 to 72 months D 72 to 96 months E more than 96 months
Carcass Maturity • Based on bone ossification • Order: • Sacral • Lumbar • Thoracic
A maturity • Note cartilage in buttons on tip of chine bone • No evidence of bone
D maturity • Note ossification of buttons on tip of chine bone
Abundant Moderately Abundant Slightly Abundant Moderate Modest Small Slight Traces Practically Devoid Devoid USDA Marbling Score
Moderately Abundant Slightly Abundant Moderate Modest Small Slight