Download
1 / 11
160 likes | 851 Views
Nonlinear regression. Regression is fitting data by a given function (surrogate) with unknown coefficients by finding the coefficients that minimize the sum of the squares of the difference with the data. In linear regression, the assumed function is linear in the coefficients, for example, .

E N D
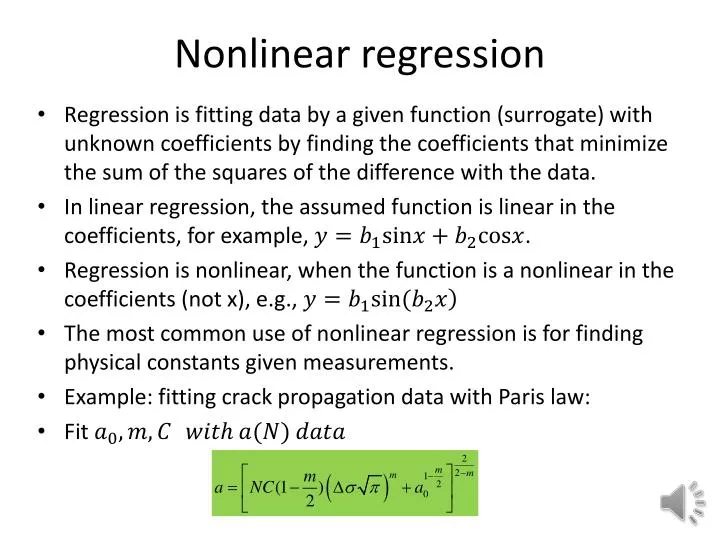
Nonlinear regression • Regression is fitting data by a given function (surrogate) with unknown coefficients by finding the coefficients that minimize the sum of the squares of the difference with the data. • In linear regression, the assumed function is linear in the coefficients, for example, . • Regression is nonlinear, when the function is a nonlinear in the coefficients (not x), e.g., • The most common use of nonlinear regression is for finding physical constants given measurements. • Example: fitting crack propagation data with Paris law: • Fit
Review of Linear Regression • Surrogate is linear combination of given shape functions • For linear approximation • Difference (residual) between data and surrogate • Minimize square residual • Differentiate to obtain
Basic equations • General form • Residuals • Rmserror • Finding the coefficients requires the solution of an optimization problem. • However, minimizing the sum of squares is a specialized problem with specialized algorithms. Matlablsqnonlin is very good.
Example – Linear vs. Nonlinear Regression • y(1) = 20, y(2) = 7, y(3) = 5, and y(4) = 4. • Data suggests a rational function • Compare to quadratic polynomial • Both use three coefficients • Get
Estimating uncertainty in coefficients • Brute force approach, generate noise in data and repeat multiple times • Alternatively linearize about optimum set of coefficients b* • Now perform linear regression with . • Provides improvement to solution • Provides estimate of uncertainty in , which is an estimate for the uncertainty in
Model based error for linear regression • The common assumptions for linear regression • Surrogate is in functional form of true function • The data is contaminated with normally distributed error with the same standard deviation at every point. • The errors at different points are not correlated. • Under these assumptions, the noise standard deviation (called standard error) is estimated as. • Similarly, the standard error in the coefficients is
Rational function example • Linearize with respect to b’s • Perform fit by linear regression =1.0e-007* [0.14350.36850.1230]’ • Finally perform error analysis • Standard errors range between 4% to 10% of the b’s (1.99 -6.99 0.612)
Application to crack propagation • Paris law and its solution • Coppe, A. ,Haftka, R.T., and Kim, N.H. (2011) " Uncertainty Identification of Damage Growth Parameters Using Nonlinear Regression" AIAA Journal ,Vol 49(12), 2818–2621 • Properties to be identified from measurements
Example with only m unknown • Simulation with b=0 v=[-1,1]mm, m=3.8 • Excellent agreement between Monte Carlo (1,000 repetitions) simulation and linearization.
All three unknown • Difficult to differentiate between initial crack size and bias
Problems • Using the data for the rational function, repeat the fit and the uncertainty calculation for an exponential decay model • Instead of using the data in Slide 4, generate your own data for 31 uniformly distributed points (1,1.3,…)from the identified algebraic model and contaminate the data with normally distributed random noise with zero mean and standard deviation of 1. Compare the standard error from linear regression with the value you get by repeating the process multiple times using different realizations of the noise.