Download
1 / 51
580 likes | 779 Views
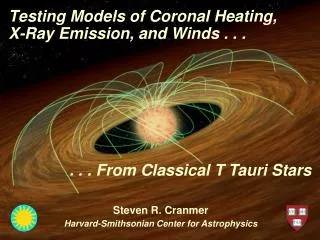
Waves and coronal heating. Dipankar Banerjee Indian Institute of Astrophysics. The Sun’s Structure. Solar interior: Everything below the Sun’s (optical) surface Divided into hydrogen-burning core, radiative and convective zones Solar atmosphere: Directly observable part of the Sun.

E N D
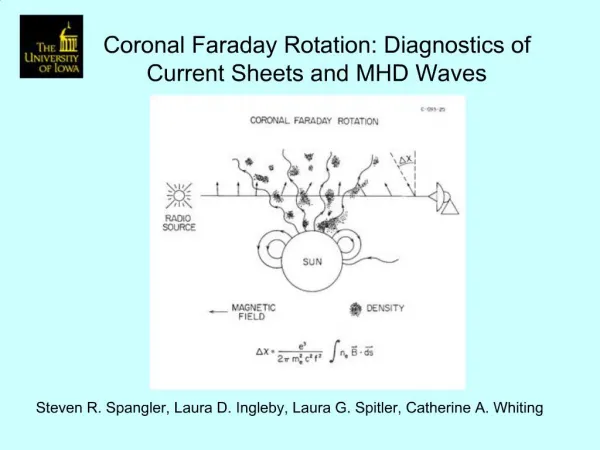
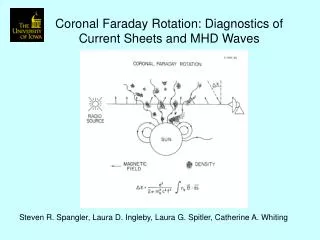
Waves and coronal heating Dipankar Banerjee Indian Institute of Astrophysics
The Sun’s Structure Solar interior: • Everything below the Sun’s (optical) surface • Divided into hydrogen-burning core, radiative and convective zones Solar atmosphere: • Directly observable part of the Sun. • Divided into photosphere, chromosphere, corona, heliosphere
The solar surface • Since solar material does not exhibit a phase transition (e.g. from solid or liquid to gaseous as for the Earth), a standard way to define the solar surface is through its radiation. • The photons travelling from the core outwards make a random walk, since they are repeatedly absorbed and reemitted. The mean free path increases rapidly with radial distance from the solar core (as the density and opacity decrease). • A point is reached where the average mean free path becomes so large that the photons escape from the Sun. This point is defined as the solar surface. It corresponds to optical depth τ = 1. Its height depends on λ. • Often τ = 1 at λ=5000 Å is used as a standard for the solar surface.
The Sun’s atmosphere • The solar atmosphere is generally described as being composed of multiple layers, with the lowest layer being the photosphere, followed by the chromosphere, the transition region and the corona. • In its simplest form it is modelled as a single component plane-parallel atmosphere. • Density drops exponentially: ρ(z) = ρ0 exp(-z/Hρ) (for isothermal atmosphere). T=6000K Hρ≈ 100km
The Sun’s atmosphere • The solar atmosphere is generally described as being composed of multiple layers, with the lowest layer being the photosphere, followed by the chromosphere, the transition region and the corona. • In its simplest form it is modelled as a single component plane-parallel atmosphere. • Density drops exponentially: ρ(z) = ρ0 exp(-z/Hρ) (for isothermal atmosphere). T=6000K Hρ≈ 100km
The photosphere • The photosphere extends between the solar surface and the temperature minimum, from which most of the solar radiation arises. • The visible, UV (λ> 1600Å) and IR (< 100μm) radiation comes from the photosphere. • 4000 K < T(photosphere) < 6000 K • T decreases outwards Bν(T)decreases outward absorption spectrum • LTE is a good approximation • Energy transport by convection and radiation • Main structures: Granules, sunspots and faculae
Chromosphere • Layer lying just above the photosphere, at which the temperature appears to be increasing outwards (classically forming a temperature plateau at around 7000 K) • Assumption of LTE breaks down • Energy transport mainly by radiation and waves • Assumption of plane parallel atmosphere is very likely to break down as well. • Strong evidence for a spatially and temporally inhomogeneous chromosphere (gas at T<4000K is present beside gas with T>8000 K)
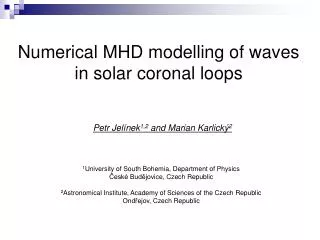
Temperature stratification of solar atmosphere G-band Ca II H Temperature minimum Most of visible light is emitted from the photosphere, 500-km thin layer around the surface of the Sun.
The Solar Optical Telescope (SOT) on Hinode observes photosphere and chromosphere Corona Chromosphrer Temperature minimum Photosphere Magnetic field
“Microscopic” observation by SOT 430nm wavelength band (G-band) Magnetogram Ca II Solar Optical Telescope (SOT) on Hinode is the largest solar telescope flown in space, which provides the best spatial resolution. Its “microscopic” observation allows to observe fine structures in a Sun spot.
Implication of chromospheric heating G-band (Photosphere) Ca II H (Chromosphere) SOT/Hinode can simultaneously observe photosphere and chromosphere. G-band bright points indicate strong magnetic fluxs. Bright structures in Ca II H implies heating in the chromosphere. These precious data set provide a clue to the chromospheric heating.
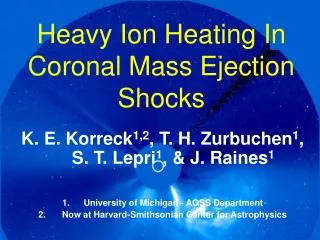
The Solar Corona 5,000 o C • The corona is the area just above the surface. While the surface is about 5,000o Celsius, the temperature in the corona reaches about 2 million degrees Celsius. What causes this rapid increase in tempera-ture is still one of the big mysteries in solar physics. 2,000,000 o C Corona Solar interior Surface The black circle divides two images.
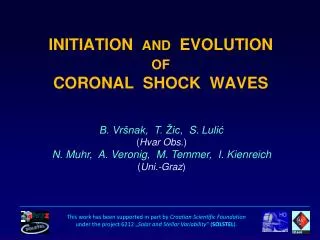
The Sun’s Magnetic Field • The Sun is strongly affected by magnetic forces. • The redarrows show open magnetic field lines emerging from the poles. • The grayarrowsrepresent solar wind particles which carry field lines with it. • The bright active regions have closed magnetic field lines (orange).
Solar Activity 1992-1999 1992 1999 Yohkoh Soft X-ray Kitt Peak magnetograms
Heating of the Corona: The Magnetic Carpet Constant magnetic flux emergence, fragmentation and disappearance: T 40 hours Each one of these loops carries as much energy as a large hydroelectric plant would generate in 1 million years
Background • To understandhow the corona is beingheatedup and maintained at such a hightemperatures (fewmillion kelvin) – coronalheatingproblem • Solarwindacceleration – to understandhow the solarwind is beingaccelerated - upto 600 km/s in polarregions (fastsolarwind ) - upto 300 km/s in equatorialregions (slowsolarwind) • Alsohelpful in solarweatherprediction
Overview • Introduction • Standing modes • Kink mode • Higher harmonics • Propagating Waves • Slow magneto-acoustic waves • Detection & Examples • Our Results • Waves or flows?
MHD solutions with pressure and magnetic forces as restoring forces
Two types of fast magneto-acoustic modes in a slender tube geometry: Kink and Sausage modes
Standing modes: kink modes • The first observation of kink mode was by Aschwanden et al. (1999) followed by Nakariakaov et al. (1999), Schrijver et al. (2002), Verwichte et al. (2004) and the most recent one is by De moortel and Brady (2007). • The observatoins of Verwichte and De moortel show the presence of higher harmonics. • The importance of higher harmonics is discussed by Andries et al. (2005)
(left) shows the original and (right) shows the results fromsimulations. Aschwanden et al. (1999) Triggeredby a blast waveafter a flare Meanoscillation Period: 280 +/- 30s
Observations with SUMER (UV Spectrometer) Dopplergram showing the up- and downflows Hassler et al. 1999 Science
Solar wind originates in coronal funnels Tu et al. 2005 Science
Interplume Noci et. al. 1997 Giordano et. al. 2000 Wilhelm et. al. 2000 Patsourakos & Vial 2000 Teriaca et. al. 2003 Raouafi et. al. 2007 Plume Casalbuoni et. al. 1999 Gabrial et. al. 2003 Gabrial et. al. 2005 Acceleration of Wind: Plume vs. Interplume This topic is highly debated and still open
There are several MHD models which describes the role of MHD waves in the acceleration of fast solar wind in coronal holes (Ofman 2005, Cranmer 2009). Some of these waves originate from the on-disk bright regions (Banerjee et. al. 2001). All these studies point to the presence of slow magneto-acoustic waves (Deforest & Gurman 1998, Banerjee et. al. 2009a). Using line width variations with height, propagating Alfven waves have been reported in coronal holes (Banerjee et. al. 1998, 2009b; Dolla & Solomon 2008, Landi & Cranmer 2009). This Alfven waves are believed as a promising candidate for the heating and acceleration of Solar wind (Belcher 1971, Suzuki & Inutsuka 2005). Waves in Coronal holes
STEREO Observations of Quasi-Periodically Driven High Velocity Outflows in Polar Plumes
The observed jets are remarkably similar in intensity enhancement, periodicity and velocity to those observed in other magnetic regions of the solar atmosphere. They are multi-thermal in nature. We infer that the jets observed on the plumes are a source of heated mass to the fast solar wind. Further, based on the previous results that motivated this study, we suggest that these jets originated in the upper chromosphere • In almost all polar plumes observed at the limb in these STEREO sequences, in all coronal pass bands, we observe high speed jets of plasma traveling along the structures with a mean velocity of 135 km/s at a range of temperatures from 0.5-1.5 MK. • The jets have an apparent brightness enhancement of ∼5% above that of the plumes they travel on and repeat quasi-periodically, with repeat times ranging from five to twenty-five minutes. • We also notice a very weak, fine scale, rapidly evolving, but ubiquitous companion of the plumes that covers the entire coronal hole limb.
NeVIII time-distance radiance map In the on-disk region, disturbance originates at bright location and propagates with speed of 25 km/s, increasing to 38 km/s close to limb and to about 130 km/s in the off-limb region. The period of propagation is in range of ~14-20 min. (Gupta, Banerjee et al. 2010, ApJ)
Waves: First Observation Propagation speed ~ 75-150 km/s with periods of 10-15 min DeForest & Gurman, (1998)
Coronal Holes: Plumes and Interplumes Differences: Plumesaredenser and coolerthan the surroundinginterplumeregion (Wilhelm 2006). Spectrallinesareobserved to bebroader in interplume as compared to plume (Banerjee et. al. 2000). DeForest et al. 1997
Alfvénic waves with sufficient energy to power the quiet solar corona and fast solar wind Scott W. McIntosh, Bart De Pontieu, Mats Carlsson, Viggo Hansteen, Paul Boerner & Marcel Goossens Nature 475, 477–480 (28 July 2011) Reported observations of the transition region (between the chromosphere and the corona) and of the corona that reveal how Alfvénic motions permeate the dynamic and finely structured outer solar atmosphere. The ubiquitous outward-propagating Alfvénic motions observed have amplitudes of the order of 20 km s−1 and periods of the order of 100–500 s throughout the quiescent atmosphere
Observations of high frequency waves • The existence of magneto-hydrodynamic waves in the solar corona is expected to cause oscillations in either intensity or velocity or in FWHM (which arises due to broadening in line width) or in all • Generally intensity oscillations have been studied in the continuum, green (5303 Å) and red (6374 Å) emission lines by taking the images of the solar corona at high frequency during eclipses (Singh et al., 1997; Pasachoff et al., 2002; Singh et al., 2009). • Koutchmy et al (1983) reported velocity oscillations (43 s), Rušin et al (1994) reported intensity oscillations 5s and above. • Williams et al., Williams et al., (2001, 2002) and Katsiyannis et al.,(2003) reported rapidly propagating compressible wave trains in coronal loops with the SECIS instrument during a total solar eclipse (quasi-periods 6s).
Mission Orbit Overview • With a near-polar orbit a satellite goes around the Earth, passes over the same points on the Earth's surface at the same local times each day and a different swathe of territory on each orbit. A dawn-dusk orbit is a special case of a sun-synchronous orbit in which a satellite perpetually trails the shadow of the Earth cast by the Sun. Because the satellite is close to the shadow, the part of the Earth's surface directly below the satellite is always at sunset or sunrise, hence the name of this type of orbit. An advantage of it is that the satellite always has its solar panels bathed in sunlight so that it can produce power by this means continuously. • The Aditya sun-synchronous polar orbit will Experience short eclipses ( about 4 months/yr) • A max of < 20 min per 90 min orbit at low earth Orbit (800 km)
Sit and stare observations JOP 196 and HOP 45 Program Aim: Multi-wavelength detection of propagating waves in polar coronal hole Participating Instruments: SUMER and CDS on-board SoHO EIS, SOT and XRT on-board HINODE Two cycle of observation: 8th &15th April 2007 13th & 15th Nov 2007 • Luca Teriaca ( MPS) • Dipankar Banerjee (IIA) • Girjesh Gupta (IIA) • Shinsuke Imada (NAOJ)
Instrument Design Overview • One Telescope – 3 Science Channels • 1 Channel for Green emission line at 530.3nm due to [Fe XIV] (2 MK) • 1 Channel for Red line 637.4 nm due to [Fe x] (1 MK) • 1 Channel for continuum around 580 nm along with polarizer at three different orientations (using a polariser wheel) • Internally occulted. Disk light should be removed at the prime focus. Off axis design • Use of Lyot stop for removing the scattered light or the diffraction effects of the entrance aperture • FOV : 1.05 R0 to 3.0 R0 radius • Detector required 2K X 2 K CCD or CMOS with high dynamic range • Few frames per second • On-board data compression • Uses look-up tables • Lossless (RICE) and lossy may be available