Download
1 / 16
160 likes | 166 Views
Comparing Population Parameters (Z-test, t-tests and Chi-Square test). Dr. M. H. Rahbar Professor of Biostatistics Department of Epidemiology Director, Data Coordinating Center College of Human Medicine Michigan State University. Is there an association between Drinking and Lung Cancer?.

E N D
Comparing Population Parameters (Z-test, t-tests and Chi-Square test) Dr. M. H. Rahbar Professor of Biostatistics Department of Epidemiology Director, Data Coordinating Center College of Human Medicine Michigan State University
Is there an association between Drinking and Lung Cancer? Suppose a case-control study is conducted to test the above hypothesis?
QUESTION: Is there a difference between the proportion of drinkers among cases and controls?
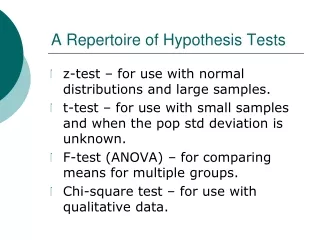
Elements of Testing hypothesis • Null Hypothesis • Alternative hypothesis • Level of significance • Test statistics • P-value • Conclusion
Case Control Study of Drinking and Lung Cancer Null Hypothesis: There is no association between Drinking and Lung cancer, P1=P2 or P1-P2=0 Alternative Hypothesis: There is some kind of association between Drinking and Lung cancer, P1P2 or P1-P20
Based on the data in the following contingency table we estimate the proportion of drinkers among those who develop Lung Cancer and those without the disease?
Test Statistic How many standard deviations has our estimate deviated from the hypothesized value if the null hypothesis was true?
P-value for a two tailed test P-value= 2 P[Z > 2.003] = 2(.024)=0.048 How does this p-value compared with =0.05? Since p-value=0.048 < =0.05, reject the null hypothesis H0 in favor of the alternative hypothesis Ha. Conclusion: There is an association between drinking and lung cancer. Is this relationship causal?
Chi-Square Test of Independence(based on a Contingency Table)
In the following contingency table estimate the proportion of drinkers among those who develop Lung Cancer and those without the disease?
E11=1700(60)/4000=25.5 E12=34.5 E21=1674.5 E22=2265.5
How do we calculate P-value? • SPSS, Epi-Info statistical packages could be used to calculate the p-value for various tests including the Chi-Square Test • If p-value is less than 0.05, then reject the null hypothesis that rows and column variables are independent
Testing Hypothesis When Two Population Means are Compared H0: 1= 2 Ha: 1 2
QUESTION: Is there an association between age and Lung Cancer?
Use Two-sample t-test when both samples are independent • H0: 1 = 2 vs Ha: 1 2 • H0: 1 - 2 = 0 vs Ha: 1 - 2 0 • t= difference in sample means – hypothesized diff. SE of the Difference in Means • Statistical packages provide p-values and degrees of freedom • Conclusion: If p-value is less than 0.05, then reject the equality of the means
Paired t-test for Matched case control study • H0: 1 = 2 vs Ha: 1 2 • H0: 1 - 2 = 0 vs Ha: 1 - 2 0 • Paired t-test= Mean of the differences –0 SE of the Differences in Means • Statistical packages provide p-values for paired t-test • Conclusion: If p-value is less than 0.05, then reject the equality of the means