Download

1 / 26
290 likes | 518 Views
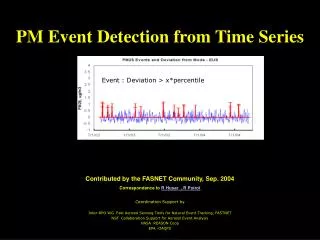
Change-Point Detection Techniques for Piecewise Locally Stationary Time Series. Michael Last National Institute of Statistical Sciences Talk for Midyear Anomaly Detection Workshop 2/3/2006. Stationary Time Series.

E N D
Change-Point Detection Techniques for Piecewise Locally Stationary Time Series Michael Last National Institute of Statistical Sciences Talk for Midyear Anomaly Detection Workshop 2/3/2006
Stationary Time Series • We call a time series stationary if the distribution of (xi,xk) depends only on l=i-k • Usually use weakly stationary, where we only look at the first two moments (equivalent in Gaussian case) • Example: Sunspot numbers, Chandler Wobble, rainfall (over decades)
Detecting Changes: Piecewise Stationary Time Series • Many series not stationary • Earthquakes • Speech • Finance • How to model? • Try stationary between change-points
Problems With This Approach • Adak (1998) proposed computing distance between power spectrum computed over small windows – if adjacent windows are “close”, then merge them into a larger window • Finds too many change-points in earthquakes. • E.g. secondary wave tapers off, but change-points will be detected
Time-Varying Power Spectrum • Power spectrum computed over a window about a point • Window width selection an open question • Does this have features we can use? • Yes!
Finding Abrupt Changes • What do we mean by abrupt changes? • Distance between spectrum • Spectrum as distribution, K-L Information Discrimination • Requirement of local estimation
Theoretical Performance • Maximum away from change-points converges to 1. Rate of convergence: • Consistently estimated with smoothed periodograms • Asymptotically normal • Finite sample critical values independent of underlying signal • n is length of window, T is length of series
Simulation Results • Simulations to determine effectiveness of change-point localization and identification • Separated tasks • 8 types of series with different features • Minimal amount of tuning • Compared with other methods • Results: • Good localization • 65+% correct identification
Speech Segmentation • Abrupt changes exist at transitions between phonemes • Can we reliably recover these? • Given segmented speech, can we meaningfully cluster it? • Can we interpret clusters? • Can we use the clusters to deduce speaker, accent, or language?
Window Width Considerations • Need a window with enough data to estimate several frequencies in the range where interesting events happen • Below 10Hz for earthquakes • At least down to 20Hz for audio • At present, this remains one of the major tuning parameters. In effect, wide windows have low variance but risk higher bias
How to asses a “Significant Change” • Asymptotic Distribution: • Test statistic sum of variables with an F distribution plus their inverses • Asymptotic normality • Problem: Events of interest are in the tail, asymptotic results break down in tails of distributions • Test statistic signal independent • Simulate on white noise, pick significance from there
End of Talk • Slides which may address specific questions follow, but unless I’ve talked way too fast, there probably won’t be time to show these. So let’s break for coffee, and if anybody has a burning desire to learn more about what I’ve said, please come and ask me – I’m happy to answer any questions, and may just have a slide lying around to answer with
Finding the Change-Point(s) • Assume correct number of change-points, and find
Issues • How to assess a “significant change?” • Uncertainty in location? • Choosing parameters • Window width • Smoothing • Weights
Choosing Parameters:Window Width • We need a window width much wider or much narrower than the scale interesting changes happen on • Much wider and the series mixes within a window • Much narrower and continuity of time-varying power spectrum kicks in • Same scale and oscillations can be detected as big changes
Smoothing • Makes estimate consistent • Ruins independence in frequency • Another tuning parameter • Bandwidth matters more than shape • Current heuristic is about square-root of number of frequencies, seems to work well
Weights • Method for incorporating prior knowledge • High weights for frequencies where real changes likely, low for where real changes unlikely • Akin to placing a prior on what frequencies changes will happen on • Equivalent to linear filter of signal
Speech: Unresolved Issues • Frequency domain representation of speech different across speakers – e.g. Jessica speaks at a higher pitch (frequency) than I do • Can we find a transform to fix this? • After solving this problem, what is the next problem?