Download
1 / 59
590 likes | 822 Views
Diversification and the CAPM . The relationship between risk and expected returns. Introduction . Investors are concerned with Risk Returns What determines the required compensation for risk? It will depend on The risks faced by investors The tradeoff between risk and return they face.

E N D
Diversification and the CAPM The relationship between risk and expected returns ©1999 Thomas A. Rietz
Introduction • Investors are concerned with • Risk • Returns • What determines the required compensation for risk? • It will depend on • The risks faced by investors • The tradeoff between risk and return they face ©1999 Thomas A. Rietz
Agenda • Concepts of risk for • A single stock • Portfolios of stocks • Risk for the diversified investor: Beta • Calculating Beta • The relationship between Beta and Return: The Capital Asset Pricing Model (CAPM) ©1999 Thomas A. Rietz
Overview • Investors demand compensation for risk • If investors hold “diversified” portfolios, risk can be defined through the interaction of a single investment with the rest of the portfolios through a concept called “beta” • The CAPM gives the required relationship between “beta” and the return demanded on the investment! ©1999 Thomas A. Rietz
Expected return: What we expect to receive on average Standard deviation of returns: A measure of dispersion of actual returns Correlation The tendency for two returns to fall above or below the expected return a the same or different times Beta A measure of risk appropriate for diversified investors Diversified investors Investors who hold a portfolio of many investments The Capital Asset Pricing Model (CAPM) The relationship between risk and return for diversified investors Vocabulary ©1999 Thomas A. Rietz
Measuring Expected Return • We describe what we expect to receive or the expected return: • Often estimated using historical averages (excel function: “average”).
Example: Die Throw • Suppose you pay $300 to throw a fair die. • You will be paid $100x(The Number rolled) • The probability of each outcome is 1/6. • The returns are: • (100-300)/300 = -66.67% • (200-300)/300 = -33.33% …etc. • The expected return E(r) is: • 1/6x(-66.67%) + 1/6x(-33.33%) + 1/6x0% + 1/6x33.33% + 1/6x66.67% + 1/6x100% = 16.67%!
Example: IEM • Suppose • You buy and AAPLi contract on the IEM for $0.85 • You think the probability of a $1 payoff is 90% • The returns are: • (1-0.85)/0.85 = 17.65% • (0-0.85)/0.85 = -100% • The expected return E(r) is: • 0.9x17.65% - 0.1x100% = 5.88%
Example: Market Returns • Recent data from the IEM shows the following average monthly returns from 5/95 to 10/99: • (http://www.biz.uiowa.edu/iem/markets/compdata/compfund.html)
Measuring Risk: Standard Deviation and Variance • Standard Deviation in Returns: • Often estimated using historical averages (excel function: “stddev”)
Example: Die Throw • Recall the dice roll example: • You pay $300 to throw a fair die. • You will be paid $100x(The Number rolled) • The probability of each outcome is 1/6. • The expected return E(r) is 16.67%. • The standard deviation is:
Example: IEM • Suppose • You buy and AAPLi contract on the IEM for $0.85 • You think the probability of a $1 payoff is 90% • The returns are: • (1-0.85)/0.85 = 17.65% • (0-0.85)/0.85 = -100% • The expected return E(r) is: • 0.9x17.65% - 0.1x100% = 5.88% • The standard deviation is: • [0.9x(17.65%)2 + 0.1x(-100%)2 - 5.88%2]0.5 = 35.29%
Example: Market Returns • Recent data from the IEM shows the following average monthly returns & standard deviations from 5/95 to 10/99: • (http://www.biz.uiowa.edu/iem/markets/compdata/compfund.html)
Measures of Association • Correlation shows the association across random variables • Variables with • Positive correlation: tend to move in the same direction • Negative correlation: tend to move in opposite directions • Zero correlation: no particular tendencies to move in particular directions relative to each other
Covariance and Correlation • Covariance in returns, sAB, is defined as: • The correlation, rAB, is defined as: • rAB is in the range [-1,1] • Often estimated using historical averages (excel function: “correl”)
Notation for Two Asset and Portfolio Returns Item Asset A Asset B Portfolio Actual Return rAi rBi rPi Expected Return E(rA) E(rB)E(rP) Variance sA2sB2sP2 Std. Dev. sA sB sP Correlation in Returns rAB Covariance in Returns sAB = sAsBrAB
Example: IEM • Suppose • You buy an MSFT090iH for $0.85 and a MSFT090iL contract for $0.15. • You think the probability of $1 payoffs are 90% & 10% • The expected returns are: • 0.9x17.65% + 0.1x(-100%) = 5.88% • 0.1x566.67% + 0.9x (-100%) = -33.33% • The standard deviations are: • [0.9x(17.65%)2 + 0.1x(-100%)2 - 5.88%2]0.5 = 35.29% • [0.1x(566.67%)2 + 0.9x(-100%)2 - (-33.33%)2]0.5 = 200% • The correlation is:
Example: Market Returns • Recent data from the IEM shows the following monthly return correlations from 5/95 to 10/99: • (http://www.biz.uiowa.edu/iem/markets/compdata/compfund.html)
Two Asset Portfolios: Risk • The standard deviation is not a linear combination of the individual asset standard deviations • Instead, it is given by: • The standard deviation a the 50%/50%, AAPL & IBM portfolio is: • The portfolio risk is lower than either individual asset’s because of diversification.
Correlations and Diversification • Suppose • E(r)A = 16% and sA = 30% • E(r)B = 10% and sB = 16% • Consider the E(r)P and sP of securities A and B as wA and r vary...
Case 1: Perfect positive correlation between securities, i.e., rAB = +1
Case 3: Perfect negative correlation between securities, i.e., rAB = -1
3 Asset Portfolios: Expected Returns and Standard Deviations • Suppose the fractions of the portfolio are given by wAAPL, wIBM and wMSFT. • The expected return is: • E(rP) = wAAPLE(rAAPL) + wIBME(rIBM) + wMSFTE(rMSFT) • The standard deviation is:
The Concept of Risk With N Risky Assets • As you increase the number of assets in a portfolio: • the variance rapidly approaches a limit, • the variance of the individual assets contributes less and less to the portfolio variance, and • the interaction terms contribute more and more. • Eventually, an asset contributes to the risk of a portfolio not through its standard deviation but through its correlation with other assets in the portfolio. • This will form the basis for CAPM.
Variance of a naively diversified portfolio of N assets • Portfolio variance consists of two parts: • 1. Non-systematic (or idiosyncratic) risk and • 2. Systematic (or covariance) risk • The market rewards only systematic risk because diversification can get rid of non-systematic risk
Consider Naive Portfolios of 1 through all 26 of these Assets (Added in Alphabetical Order)
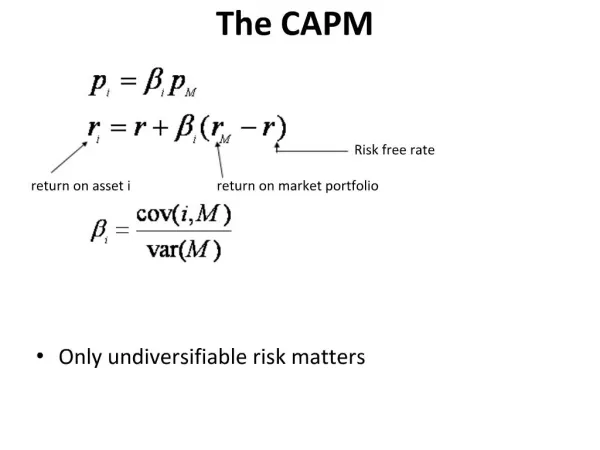
The Capital Asset Pricing Model • CAPM Characteristics: • bi = sismrim/sm2 • Asset Pricing Equation: • E(ri) = rf + bi[E(rm)-rf] • CAPM is a model of what expected returns should be if everyone solves the same passive portfolio problem • CAPM serves as a benchmark • Against which actual returns are compared • Against which other asset pricing models are compared
CAPM Assumptions • No transactions costs • No taxes • Infinitely divisible assets • Perfect competition • No individual can affect prices • Only expected returns and variances matter • Quadratic utility or • Normally distributed returns • Unlimited short sales and borrowing and lending at the risk free rate of return • Homogeneous expectations
How would you find the efficient frontier? 1. Find all asset expected returns and standard deviations. 2. Pick one expected return and minimize portfolio risk. 3. Pick another expected return and minimize portfolio risk. 4. Use these two portfolios to map out the efficient frontier.
Three Important Funds • The riskless asset has a standard deviation of zero • The minimum variance portfolio lies on the boundary of the feasible set at a point where variance is minimum • The market portfolio lies on the feasible set and on a tangent from the riskfree asset
Tobin’s Two-Fund Separation • When the riskfree asset is introduced, • All investors prefer a combination of 1) The riskfree asset and 2) The market portfolio • Such combinations dominate all other assets and portfolios
The Capital Market Line • All investors face the same Capital Market Line (CML) given by:
Equilibrium Portfolio Returns • The CML gives the expected return-risk combinations for efficient portfolios. • What about inefficient portfolios? • Changing the expected return and/or risk of an individual security will effect the expected return and standard deviation of the market! • In equilibrium, what a security adds to the risk of a portfolio must be offset by what it adds in terms of expected return • Equivalent increases in risk must result in equivalent increases in returns.
How is Risk Priced? • Consider the variance of the market portfolio: • It is the covariance with the market portfolio and not the variance of a security that matters • Therefore, the CAPM prices the covariance with the market and not variance per se