Download
1 / 29
290 likes | 453 Views
An Active Approach to Statistical Inference using Randomization Methods. Todd Swanson & Jill VanderStoep Hope College Holland, Michigan. Outline. Background Content Pedagogy Example Assessment Future. Inspiration.

E N D
An Active Approach to Statistical Inference using Randomization Methods Todd Swanson & Jill VanderStoep Hope College Holland, Michigan
Outline • Background • Content • Pedagogy • Example • Assessment • Future
Inspiration “Our curriculum is needlessly complicated because we put the normal distribution, as an approximate sampling distribution for the mean, at the center of the curriculum, instead of putting the core logic of inference at the center.” George Cobb (USCOTS 2005) Background● Content ● Pedagogy ● Example ● Assessment ● Future
Previous Work Concepts of Statistical Inference: A Randomization-Based Curriculum • An NSF funded project in which modules were developed to teach inference through randomization techniques. • Principle Investigators: Allan Rossman and Beth Chance (Cal Poly) • Work done in 2007-08 Background● Content ● Pedagogy ● Example ● Assessment ● Future
Development of Text An Active Approach to Statistical Inference • Along with Nathan Tintle, we developed first draft of a text in 2009 • Used the modules developed by Rossman and Chance as the base • First used at Hope College in the Fall of 2009 Background● Content ● Pedagogy ● Example ● Assessment ● Future
Development of Text • Revisions were made during summer 2010. • This fall we have joined up with Allan Rossman, Beth Chance and Soma Roy (all of Cal Poly) and George Cobb (Mt. Holyoke) to continue to make significant revisions to our materials. Background● Content ● Pedagogy ● Example ● Assessment ● Future
Content • We begin with inference on the first day of the course and teach it throughout the entire semester • First half of course is based on randomization methods and second half is based on traditional methods Background● Content ● Pedagogy ● Example ● Assessment ● Future
Table of Contents (Unit 1) • Chapter 1: Introduction to Statistical Inference: One proportion • Flipping coins and applets are used to model the null and their results are used to determine p-values. • Chapter 2: Comparing Two Proportions: Randomization Method • Explanatory and response variables are introduced • Permutation tests are introduced • First by using playing cards then with Fathom (perhaps applets in the future) • Observational studies/experiments Background ● Content ● Pedagogy ● Example ● Assessment ● Future
Table of Contents (Unit 1) • Chapter 3: Comparing Two Means: Randomization Method • Measurements of spread • Permutation tests of means with cards and Fathom • Type I and type II errors introduced • Chapter 4: Correlation and Regression: Randomization Method • Scatterplots, correlation, and regression are reviewed • Permutation tests are used to test correlation Background ● Content ● Pedagogy ● Example ● Assessment ● Future
Table of Contents (Unit 2) • Chapter 5: Correlation and Regression: Revisited • Sampling distributions are used to model scrambled distributions • Confidence intervals (range of plausible values) • Power is defined and students explore how it relates to sample size, significance level, and population correlation • Chapter 6: Comparing Means: Revisited • Standard deviation, normal distributions, and t-distributions • The independent samples t test is introduced • Confidence intervals and power • Paired-data t test and ANOVA are also introduced Background ● Content ● Pedagogy ● Example ● Assessment ● Future
Table of Contents (Unit 2) • Chapter 7: Comparing Proportions: Revisited • Power is explored in relationship to the difference in population proportions, sample size, significance level, and size of the two proportions • The chi-square test for association is introduced • Chapter 8: Tests of a Single Mean and Proportion • Single proportion: binomial, normal distributions, and confidence intervals • Single mean: t-test and confidence intervals • Chi-squared goodness of fit test Background ● Content ● Pedagogy ● Example ● Assessment ● Future
Main differences between our randomization curriculum and traditional ones • Traditional method of teaching introductory statistics: • Descriptive statistics • Probability and sampling distributions • Inference • Randomization method • Inference on day one Background ● Content ● Pedagogy ● Example ● Assessment ● Future
Main differences between our randomization curriculum and traditional ones • Most of the time we visit and re-visit the core-logic of statistical inference as first demonstrated by randomization methods. • We spend limited time teaching descriptive statistical methods and instead include time to review and reinforce the proper use of descriptive statistical methods through hands-on real data analysis experiences. • We eliminate the explicit coverage of probability and sampling distributions. Background ● Content ● Pedagogy ● Example ● Assessment ● Future
Main differences between our randomization curriculum and traditional ones • We present an intuitive approach to power by looking at the relationships between power and sample size, standard deviation, difference in population proportions or means, etc. We think this helps students better understand the core logic of statistical inference. • Confidence intervals are presented after tests. We demonstrate how tests of significance can be used to create ranges of plausible values for the population parameter. Background ● Content ● Pedagogy ● Example ● Assessment ● Future
Pedagogy • Topics are introduced through a brief lecture • Students work on activities to learn and reinforce the topics. • Tactile learning (shuffling cards and flipping coins) to estimate p-values • Computer based simulations • Collecting data and running experiments Background ● Content ● Pedagogy ● Example ● Assessment ● Future
All our classes meet in a computer classroom. Background ● Content ● Pedagogy ● Example ● Assessment ● Future
Real Data --- Real Research • We try to avoidcute, but impractical illustrations of statistics. We include real data and research that matters. • Homework problems and case-studies also involve real statistical data and research. • Each chapter contains a research paper that students read and respond to questions. • Students complete in-depth projects where they design a study, collect data, and present their results in both oral and written form. Background ● Content ● Pedagogy ● Example ● Assessment ● Future
Example: Bob or Tim? Background ● Content ● Pedagogy ● Example ● Assessment ● Future
Tim or Bob? • A study in Psychonomic Bulletin and Review (Lea, Thomas, Lamkin, & Bell, 2007) presented evidence that “people use facial prototypes when they encounter different names.” • Participants were given two faces and had to determine which one was Tim and which one was Bob. The researchers wrote that their participants “overwhelmingly agreed” on which face belonged to Tim and which face belonged to Bob. Background ● Content ● Pedagogy ● Example ● Assessment ● Future
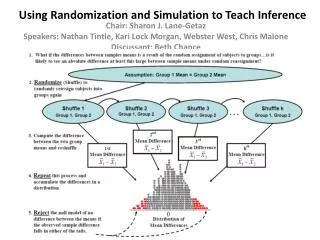
Hypotheses • Alternative hypothesis: In the population, people have a tendency to associate certain facial features with a name. More specifically, the proportion of the population that correctly matches the names with the faces is greater than 0.5. • Null hypothesis: In the population, people do not have a tendency to associate certain facial features with a name. More specifically, the proportion of the population that correctly matches the names with the faces is equal to 0.5. Background ● Content ● Pedagogy ● Example ● Assessment ● Future
Did you get it correct? Tim Bob Background ● Content ● Pedagogy ● Example ● Assessment ● Future
Statistic---Simulate---Strength of Evidence • Statistic: A recent class of statistics students (our sample) replicated this study and 23 of the 33 students (0.70) correctly identified the face that belonged to Tim. • Simulate: To simulate the null hypothesis, we flip a coin 33 times and count the number of heads each time. (Repeat this 1000 times) • Strength of Evidence: Just 17 out of 1000 repetitions gave a result of 23 or more heads. Quite unlikely if the null was true. Background ● Content ● Pedagogy ● Example ● Assessment ● Future
1000 repetitions of flipping a fair coin 33 times and counting the number of heads P-value = 0.017 Background ● Content ● Pedagogy ● Example ● Assessment ● Future
Conclusion • We have evidence supporting that in the population of interest, the proportion of people that correctly identify which face belongs to Tim and which belongs to Bob is greater than 0.50. • Thus based on our study we have evidence to support people have a tendency to associated certain facial features to a name. Background ● Content ● Pedagogy ● Example ● Assessment ● Future
Assessment • The Comprehensive Assessment of Outcomes in Statistics (CAOS) • Students in our randomization course took this pre- and post-test in the Fall of 2009 (n = 202). These results were compared with students that took our traditional course in the Fall of 2007 (n = 198) and those from a national representative sample (n = 768). • Overall, learning gains were significantly higher for students that took the randomization course when compared to either those that took the traditional course at Hope or the national sample. Background ● Content ● Pedagogy ● Example ● Assessment ● Future
Questions where the new curriculum faired significantly better • Understanding that low p-values are desirable in research studies (Tests of significance) • Understanding that no statistical significance does not guarantee that there is no effect (Tests of significance) • Ability to recognize a correct interpretation of a p-value (Tests of significance) • Ability to recognize an incorrect interpretation of a p-value. Specifically, probability that a treatment is not effective. (Tests of significance) Background ● Content ● Pedagogy ● Example ● Assessment ● Future
Questions where the new curriculum faired significantly better • Understanding of the purpose of randomization in an experiment (Data collection and design) • Understanding of how to simulate data to find the probability of an observed value (Probability) Background ● Content ● Pedagogy ● Example ● Assessment ● Future
Questions where the new curriculum faired significantly worse • Ability to correctly estimate and compare standard deviations for different histograms. (Descriptive statistics) Background ● Content ● Pedagogy ● Example ● Assessment ● Future
Moving Forward • We welcome anyone that would like to field test the book. • More information can be found at www.math.hope.edu/aasi • Email • Todd: swansont@hope.edu • Jill: vanderstoepj@hope.edu Background ● Content ● Pedagogy ● Example ● Assessment ● Future