Download
1 / 1
10 likes | 186 Views
How the AMOC affects climate on decadal to centennial timescales: the North Atlantic versus an interhemispheric seesaw. Les Muir and Alexey V. Fedorov Dept. Geology and Geophysics, Yale University. Les.muir@yale.edu. Power spectra: the AMOC, NH SST, SH SST.

E N D
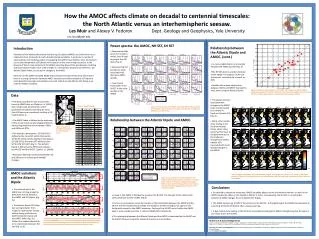
How the AMOC affects climate on decadal to centennial timescales: the North Atlantic versus an interhemispheric seesaw. Les Muir andAlexey V. Fedorov Dept. Geology and Geophysics, Yale University Les.muir@yale.edu Power spectra: the AMOC, NH SST, SH SST Relationship between the Atlantic Dipole and AMOC. (cont.) Introduction Variations of the Atlantic Meridional Overturning Circulation (AMOC) are believed to be an important driver of decadal to multi-decadal climate variability. In particular a number of observational and modeling studies investigating the AMOC have linked an inter-hemispheric sea surface temperature (SST) dipole to fluctuation in the overturning circulation. In the absence of direct measurements of the AMOC extending beyond the past decade, modeling and observational studies have used changes in a hemispheric temperature difference, the Atlantic Dipole Index, as a proxy for changes in the AMOC. Here we use the CMIP5 (Coupled Model Intercomparison Project Phase 5) to determine if there is a strong connection between AMOC variations and the hemisphere SST dipole at multi-decadal timescales and whether one could indeed use the Atlantic SST dipole as an index for AMOC variability. • Dominant periods vary from model to model, from 8 years to greater than 80 years (Fig. 4). • Dominant NH SST periods are often associated with dominant AMOC periods. • Few models show peaks in the SH SST at the same periods as the AMOC. • In many models there is a strong link between the AMOC and SST (Fig. 5). •The NH SST alone is a better estimate of the AMOC. The addition of SH SSTs reduces the correlation by as much as 30%. • Models with a weak relationship between AMOC and NHSST improve the most when using the Atlantic Dipole. Figure 5: Maximum lag correlations of the AMOC Index against the Atlantic Dipole (ordinate) and against the NH SST (abscissa). Points below the diagonal indicate that the NH SST is a better approximation to the AMOC than the Atlantic Dipole. Data • The data considered in this study comes from the CMIP5 data set [Taylor et. al. (2012)]. Only models with preindustrial control (piControl) simulations extending for more than 450 years are considered, resulting in 26 models (Table 1). • The AMOC Index is defined as the maximum of the annual mean zonally integrated Atlantic overturning stream function between 500m and 2000m at 30°N. • The Northern Hemisphere SST (NH SST) is defined as the mean SST within the box 60 –10°W, 40°–60°N and the Southern Hemisphere SST (SH SST) is the mean SST within the box 50°W–0°W, 40°–60°S (Fig. 1). The Atlantic Dipole is defined as the difference between the NH SST and the SH SST. [Latif et. al. (2006)] • Band-pass filtering is performed between 10 and 100 years to isolate multi-decadal changes. • The spatial structure associated with changes in the AMOC Index are dominated by increases in Northern Atlantic SSTs (Fig. 6). • While some models show cooling in the Southern Atlantic Ocean others show warming. This leads to no agreement across the models on changes to Southern Atlantic SSTs associated with multi-decadal changes in the AMOC. Table 1. Model Details. Figure 3: Power spectra of the AMOC Index (red), NH SST (blue)and the SH SST (black). Dominant periods are often shared between AMOC and NH SST, but not the SH SST. Figure 1: Location of the NH SST (blue) And the SH SST (black) boxes. Relationship between the Atlantic Dipole and AMOC. s AMOC variations and the Atlantic Dipole Figure 6: Lagged regression of SST onto the AMOC at 30oN. SST changes are in oC for a 1 Sv change in the AMOC. Numbers in the title of each panel indicate the model number (Table 1) and the lag of the NH SST (years) relatively to the AMOC Figure 4: Lag correlations of NH SST (blue), SH SST (black) and the Atlantic Dipole (red) against the AMOC index. Positive correlations at negative lag indicate AMOC changes lead SST changes. Most models show a strong link to NH SST lagging AMOC changes, with a weak link to SHSST. • The observations of the AMOC are not long enough to determine the link between the AMOC and SST dipole. (Fig. 2a) • The Atlantic Dipole SST Index has varying behavior from model to model. Some models exhibit strong oscillations in both the Atlantic Dipole and the AMOC Index (Fig. 2b). While other models show little to no relationship between the two (Fig. 2c,d). Conclusions • On decadal to centennial timescales, AMOC variability affects mainly the Northern Atlantic. In most of the CMIP5 models the effect on the Southern Atlantic is minor. Consequently, the NH SST is a much better indicator of AMOC changes than the Atlantic SST Dipole. • The AMOC explains up to 70% of the variance in the NH SST. A strengthening of the AMOC typically leads to a warming of the North Atlantic after a several-year lag. • A few models show cooling in the Southern Hemisphere following the AMOC strengthening but the signal is not robust across the models. • A peak in the AMOC is followed by a peak in the NH SST. The strength of this relationship varies greatly across the models (Fig.4). • There is no consistency across the models on the relationship between the AMOC and the SH SST. The few models that do exhibit a hemispheric SH SST cooling do not agree on the timing with respect to the AMOC maximum. Cooling of the SH SST occurs before the AMOC peak in some models and after in others (CNRM-CM5, FGOALS-s2). • The relationship between the Atlantic Dipole and the AMOC is dominated by the NHSST and the SHSST influence makes the relationship worse in most models. Figure 2: a) Observed Atlantic Dipole from HadISST (black line)and Observed AMOC (red) from RAPID-MOC. b), c), d) are model examples of the Atlantic Dipole (black) and AMOC (red) showing a range from strong agreement (b) to no agreement (d). Thick lines are decadal running means while thin lines are annual means. References & Acknowledgements Latif, M., C. Böning, J. Willebrand, A. Biastoch, J. Dengg, N. Keenlyside, U. Schweckendiek, G. Madec, 2006: Is the ThermohalineCirculation Changing?. J. Climate, 19, 4631–4637. Taylor, K.E., R.J. Stouffer, G. A. Meehl, 2012: An Overview of CMIP5 and the Experiment Design. Bull. Amer. Meteor. Soc., 93, 485-498. Funding from: DOE Grant DESC0007037“A Generalized Stability Analysis of the AMOC in Earth System Models: Implication for Decadal Variability and Abrupt Climate Change” and the Packard Foundation