Download
1 / 24
240 likes | 353 Views
Societal Impacts of Severe Weather – The Future of Prediction, Communication and Post-Event Analysis. Neil A. Stuart NOAA/NWS Albany, NY NROW X 5 November 2008. Increasing importance to evaluation of societal impacts. Urbanization of America/World Increasing population density

E N D
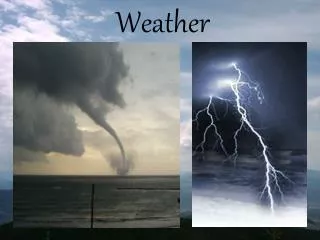
Societal Impacts of Severe Weather – The Future of Prediction, Communication and Post-Event Analysis Neil A. Stuart NOAA/NWS Albany, NY NROW X 5 November 2008
Increasing importance to evaluation of societal impacts • Urbanization of America/World • Increasing population density • Increasing exposure to hazardous weather • Huge diversity in user community • Huge spectrum in levels of vulnerability in user community • Increased liability for economic impact and loss of life
Current system of pre-event and post-event evaluation of forecast value • Sources of guidance contribute to forecast confidence of forecast scenario • Individual forecaster perception of probability of event initiates forecast/watch/warning • Graphics and text products convey level of urgency depending on perceived potential impact • Observed weather – calculate statistics for POD, FAR, CSI • Future trends – Ensemble guidance provides more quantitative probabilities for various hazards • Impacts from various hazard types evaluated • Create text and graphical products (Including PQPF?) conveying potential impact of various hazards
Valentine’s Day 2007 • Despite advances in data analysis, assimilation and visualization, some important user groups are not benefiting • Widespread 20-42” of snow Capital Region of NY and north and west • NESIS Category 3 – ranked near Blizzard of ’78 in SE New England • I-80 shut down in PA due to accidents in mixed precipitation • Many planes stranded on runways for hours at JFK airport • 35 deaths • Winter Weather Impact checklist developed at NWS Buffalo for Lake Effect events • Distributed across eastern region of NWS • Evaluation of potential utility with synoptic-scale snowstorms • Ranking of multiple types of impacts • Accumulated rank defines High, Moderate or Low Impact
Interior New York/New England • Timing – 3: Covered multiple rush hours • Seasonality – 2: Mid Season Infrequent • Phenomena – 3: Visibility <1/4 mile in heavy snow • Post Storm – 3 Windy and Temperatures <32F • Total = 11 - High • PA, Southern NY, NJ, MD • Timing – 3: Covered multiple rush hours • Seasonality – 2: Mid Season Infrequent • Phenomena – 2: Moderate/heavy sleet, wet snow or mix • Phenomena – 3: Freezing precipitation, black ice • Post Storm – 2: Windy or Temperatures <32F • Total = 8 or 9 - High
October 2008 storm • Despite advances in data analysis, assimilation and visualization, some important user groups are not benefiting • Very elevation dependent snowfall • >12” snow Catskills, Adirondacks • >6” snow Helderbergs, Schoharie Valley, parts of Green Mountains • Trace of snow Capital District, Lake George, Saratoga Regions, Berkshires • I-84 shut down in NY/PA due to mixed precipitation • >100,000 without power • Many trees/wires down • How can meteorologists help users to reduce the societal impacts of major winter storms like the Valentine’s Day 2007 and October 2008 Storms? • Need to communicate forecast information in a manner understood by the most user groups • Need to educate users on how to best use current forecast products and services • Need to coordinate with users to best tailor current and future products for their needs
Catskills, Adirondacks and Schoharie Valley • Timing – 3: Covered multiple rush hours (if rush hour exists in the mountains!) • Seasonality – 3: First storm of season • Phenomena – 2: Moderate/Heavy wet snow or mix • Post Storm – 2: Windy or Temperatures <32F • Total = 10 - High • Albany, valley locations • Timing – 1: overnight • Seasonality – No factor since no accumulation, but could be 3 if considered 1st storm of season • Phenomena – 1: Light intensity snow or mix • Post Storm – 1: Temperatures slowly moderating above freezing • Total = 3 – Low, but could be moderate if considered 1st storm of season
Higher elevations received accumulating snow – low impact for valley areas, including densest population centers • Divide into different elevations or divide rural vs. urban– sub county? • Limited ability to delineate sub county areas in text products due to software constraints • Increasing use of graphical forecasts needed • All synoptic-scale storms are high impact somewhere, so some division necessary • Maybe consider pavement/ground • temperatures for accumulation and road treatment factors? • Call to action statements – text or graphics? • Overstated threat in valley locations – any impact due to unnecessary preparation? • Road crews in impacted areas – best use of resources- winter still >1 month away? • Very wet snow – trees and power lines down - power companies most efficient use of resources? • Addressing variety of vulnerability factors such as age, health, wealth, gender? • Graphics of hazards on map with census/demographic data: Assist EMs/Specialized Users – see SVR slide 18 • Largely up to broadcast media to convey message to most of the user community 10/08-Valleys 1 2/07 10/08 -Mtns 2 1 2 POD=0 FAR=1 POD=1 FAR=0
Experimental Probabilistic QPF: Forecaster produced but based on POP and QPF grids – Once ensemble and forecaster probabilities calibrated, potential use in PQPF grid
Severe Thunderstorm and Tornado Warnings • Current – Polygon warnings for part of a county/counties • Successive polygon warnings for locations downstream • Verified by observation of severe weather – POD, FAR, CSI • Future trends – Probabilistic severe weather information • Polygons composed of a range of probabilities for various severe weather types • Polygons for estimated time of arrival for various severe weather types • Forecaster generated probabilities based on perceived threat – mesoscale/storm scale analyses, radar based or observed • Short-range microscale numerical models being developed for thunderstorm evolution predictions on the scale of minutes • Some private sector capability to produce future radar graphics for severe thunderstorms (not presented here) • What probability would activate EAS? • Will EAS exist in the future? – Cell phones, cable TV, NYAlert • Inspiration from probabilistic hurricane wind and surge graphics • Gridded verification – including quantifying choosing not to warn
Current Methodology New polygon issued with short lead time for location B Long lead time for location A Possible future Methodology – with assistance from meso/micro scale models (currently in development) In this case – rapid updates move polygon east little by little so locations A and B receive similar progression of information Polygon with range of probabilities updated frequently, perhaps every 5-15 minutes
Example of recent event – 24 July EF2 tornado in NH/ME 1533 UTC GYX radar image – Tornado touch down, no reports yet, SVR issued Probabilistic polygon/accum. threat could have provided tornado probabilities based on radar data Any non-zero probability can provide critical information to different user groups
Example of recent event – 24 July EF2 tornado in NH/ME 1538 UTC GYX radar image – Tornado on ground, 1st reports beginning to come in, TOR issued 1546 UTC Estimated time of arrival compliments probabilities on previous page
Some current cutting edge severe weather display products – Google Earth applications
Some current cutting edge severe weather warning and verification products Graphical and text warnings with radar and severe reports Demographic data for each warning Experimental verification statistics
Gridded/Probabilistic severe warning verification • White – forecast area gridded by Lat/Lon • Gray – Watch area • Black – Polygon Warning • Red – Severe Weather report • Many new statistics can be calculated • Red could also be radar detected mesocyclone or TVS • Quantifying choice of no warning – if warning not issued and no severe weather reported • Probabilistic warnings – even more new statistics possible
Other considerations • Social science collaborations • Emphasis on surveys and behavioral science to evaluate perceptions and psychology – input into probabilistic forecast guidance • What do users know/understand? • What are their preferred information sources? • How can the message be most clearly conveyed, minimizing misinterpretation of the risk? • What influences their decisions under stress and uncertainty? • What motivates them to prepare and respond to potentially life threatening hazards? • What capabilities do they have to prepare and respond? (Exposure and vulnerability issues) • Emphasis on economic and human impacts • NWS Service Assessments – Super Tuesday and Picher OK • Influencing government/insurance policy - Katrina • Input into community hazard mitigation • Ft. Collins floods and Katrina/Ike • Potential local collaborative study of Schoharie County NY • Partnering between all sectors • AMS Ad Hoc Committee on Communicating Uncertainty in Forecasting • National Weather Center – Government, Private Sector and Academia all in one complex • Hazardous Weather Test Bed
Acknowledgments • Iowa Environmental Mesonet division of the Iowa State University Department of Agronomy • NWS Fort Worth and the North Central Texas Council of Governments • Greg Stumpf and Travis Smith for probabilistic warning graphics • Harold Brooks for gridded severe weather graphic • Howard Altshule of Forensic Weather Consultants for pictures from 28 October 2008 storm • Eve Gruntfest and WAS*IS/SSWIM founders for promoting physical and social science collaborations that are directing future product development Thank you for your time and attention – are there any questions or comments?
Organizations paving the way for increased Social and Physical Science collaborations • Web Sites • Http://www.sip.ucar.edu/wasis - WAS*IS web site • Http://ewp.nssl.noaa.gov/wasis2008 - Probabilistic warning workshop • Http://eyewall.met.psu.edu – Source of many ensemble forecast guidance products