Download
1 / 22
270 likes | 688 Views
Operations Management Waiting-Line Models Module D. Queues / Lines. You manage a call center which can answer an average of 20 calls per hour. Your call center gets 17.5 calls in an average hour. On average, what is the time a customer spends on hold waiting for service?

E N D
Operations ManagementWaiting-Line ModelsModule D © 2004 by Prentice Hall, Inc., Upper Saddle River, N.J. 07458
Queues / Lines You manage a call center which can answer an average of 20 calls per hour. Your call center gets 17.5 calls in an average hour. On average, what is the time a customer spends on hold waiting for service? a) on average, customers should not have to wait on hold since capacity is greater than demand. b) average customer wait will be less than 10 minutes. c) average customer wait will be between 10 and 20 minutes. d) average customer wait will be greater than 20 minutes. e) who knows? There’s no way to tell. © 2004 by Prentice Hall, Inc., Upper Saddle River, N.J. 07458 © 1995 Corel Corp.
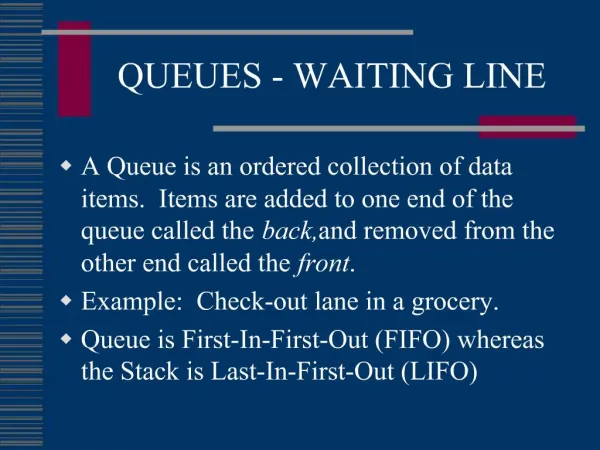
Two ways to address waiting lines • Queuing theory • Certain types of lines can be described mathematically • Requires that assumptions are valid for your situation • Systems with multiple lines that feed each other are too complex for queuing theory • Simulation • Building mathematical models that attempt to act like real operating systems • Real-world situations can be studied without imposing on the actual system © 2004 by Prentice Hall, Inc., Upper Saddle River, N.J. 07458
Why do we have to wait? Why do services (and most non-MTS manufacturers) have queues? • Processing time and/or arrival time variance • Costs of capacity – can we afford to always have more people/servers than customers? • Efficiency – e.g. scheduling at the Doctor’s office © 2004 by Prentice Hall, Inc., Upper Saddle River, N.J. 07458 © 1995 Corel Corp.
Waiting Costs and Service Costs Cost Total expected cost Minimum total cost Cost of providing service Cost of waiting time High levelof service Low level of service Optimal service level © 2004 by Prentice Hall, Inc., Upper Saddle River, N.J. 07458
Annoyed customers Lost customers Space Cost of capacity Wasted capacity Too Little Queue Too Much Queue Possible opportunity:e.g. wait in the bar for a restaurant table Costs of Queues © 2004 by Prentice Hall, Inc., Upper Saddle River, N.J. 07458
Waiting Line Examples Situation Arrivals Servers Service Process Bank Customers Teller Deposit, etc. Doctor’s Patient Doctor Treatmentoffice Traffic Cars Light Controlledintersection passage Assembly line Parts Workers Assembly 1–800 software User call-ins Tech support Technical supportsupport personnel © 2004 by Prentice Hall, Inc., Upper Saddle River, N.J. 07458
Characteristics of a Waiting Line System Service Facility Waiting Line Population • Size of the source population • Limited • Unlimited • Behavior of arrivals • Join the queue, wait until served • Balk – refuse to join the line • Renege – leave the line Arrival Characteristics • Pattern of arrivals • Scheduled • Random – estimated by Poisson distribution = average arrival rate © 2004 by Prentice Hall, Inc., Upper Saddle River, N.J. 07458
0.30 0.30 0.25 0.25 0.20 0.20 0.15 0.15 Probability Probability Probability 0.10 0.10 0.05 0.05 0.00 0.00 0 1 2 3 4 5 6 7 8 9 10 11 12 0 1 2 3 4 5 6 7 8 9 10 11 12 x x Poisson Distributions for Arrival Rates =2 =4 = average arrival rate © 2004 by Prentice Hall, Inc., Upper Saddle River, N.J. 07458
Characteristics of a Waiting Line System Service Facility Population Waiting Line Waiting Line Characteristics • Length of the queue • Limited • Unlimited • Queue discipline • FIFO • Other © 2004 by Prentice Hall, Inc., Upper Saddle River, N.J. 07458
Characteristics of a Waiting Line System Service Facility Population Waiting Line Service Characteristics • Number of channels • Single • Multiple • Number of phases in service system • Single • Multiple • Service time distribution • Constant • Random – estimated by negative exponential distribution = average service rate © 2004 by Prentice Hall, Inc., Upper Saddle River, N.J. 07458
1.0 –t Probability that Service Time is greater than t=e-t, for t > 0 Probability that Service Time is greater than t = e for t > 0 0.9 0.8 Average Service Rate () = 3 customers per hour Average Service Time = 20 minutes per customer 0.7 Average Service Rate () = 3 customers per hour Average Service Time = 20 minutes per customer 0.6 Probability that Service Time t 0.5 Average Service Rate () = 1 customer per hour Average Service Rate () = 1 customer per hour 0.4 0.3 0.2 0.1 0.0 0.00 0.25 0.50 0.75 1.00 1.25 1.50 1.75 2.00 2.25 2.50 2.75 3.00 Time t in Hours Negative Exponential Distribution © 2004 by Prentice Hall, Inc., Upper Saddle River, N.J. 07458
Single-Channel, Single-Phase Served units Arrivals Queue Service facility Single-Channel, Multi-Phase Served units Arrivals Queue Multi-Channel, Single-Phase Service facility Service facility Multi-Channel, Multi-Phase Served units Served units Queue Service facility Arrivals Service facility Service facility Queue Service facility Arrivals e.g. McDonald’s drive-through Service facility Service facility e.g. U.S. Post Office Basic Queuing System Designs e.g. drive-through bank e.g. Suds & Suds Laundromat © 2004 by Prentice Hall, Inc., Upper Saddle River, N.J. 07458
= average arrival rate = 17.5 calls/hr = average service rate = 20 calls/hr ρ= average utilization of system = / = 87.5% Call Center – Solution (1) You manage a call center which can answer an average of 20 calls per hour. Your call center gets 17.5 calls in an average hour. On average, what is the time a customer spends on hold waiting for service? © 2004 by Prentice Hall, Inc., Upper Saddle River, N.J. 07458
Call Center – Solution (2) You manage a call center which can answer an average of 20 calls per hour. Your call center gets 17.5 calls in an average hour. On average, what is the time a customer spends on hold waiting for service? = average arrival rate = 17.5 calls/hr = average service rate = 20 calls/hr ρ= average utilization of system = / = 87.5% L = average number of customers in service system (line and being served) = / ( - ) = 7 calls Lq = average number waiting in line = ρL = 6.125 calls © 2004 by Prentice Hall, Inc., Upper Saddle River, N.J. 07458
Call Center – Solution (3) You manage a call center which can answer an average of 20 calls per hour. Your call center gets 17.5 calls in an average hour. On average,what is the time a customer spends on hold waiting for service? = average arrival rate = 17.5 calls/hr = average service rate = 20 calls/hr ρ= average utilization of system = / = 87.5% W = average time in system (wait and service) = 1 / ( - ) = .4 hr = 24 min Wq = average time waiting = ρW = 21 min © 2004 by Prentice Hall, Inc., Upper Saddle River, N.J. 07458
Single server equations = average arrival rate = average service rate ρ= average utilization of system = / Pn= probability that n customers are in the system =(1- ρ) ρn L= average number of customers in service system (line and being served) = / ( - ) Lq= average number waiting in line = ρL W= average time in system (wait and service) =1/ ( - ) Wq= average time waiting = ρW © 2004 by Prentice Hall, Inc., Upper Saddle River, N.J. 07458
Izzy’s Ice Cream Stand • You are opening an ice cream stand that has a single employee (you). You expect to see about 25 customers an hour. It takes you an average of 2 minutes to serve each customer. Customers are served in a FCFS manner. • Your research suggests that if there is a line of more than 4 people that some customers will leave without buying anything. In addition, if customers have to wait more than 6 minutes to get their order filled they are not likely to come back. • How well will this system do at satisfying customers? • What assumptions are you making to answer this question? © 2004 by Prentice Hall, Inc., Upper Saddle River, N.J. 07458
Izzy’s Ice Cream Stand (2) = 25 customers/hr = 30 customers/hr ρ= / = .833 Pn = probability that n customers are in the system =(1- ρ) ρn P0= (1 – .833) x .833 = .167 .167 P1= (1 – .833) x .833 = .139 .306 P2 = (1 – .833) x .833 = .116 .422 P3 = (1 – .833) x .833 = .097 .519 P4 = (1 – .833) x .833 = .080 .599 Pmore than 4 = 1 – .599 = .401 L = / ( - ) = 5 customers cumulative 0 1 2 3 4 Customers in the system © 2004 by Prentice Hall, Inc., Upper Saddle River, N.J. 07458
Izzy’s Ice Cream Stand (3) Why not L – 1 ? = 25 customers/hr = 30 customers/hr ρ= / = .833 L = / ( - ) = 25 / (30 – 25) = 5 customers Lq = ρL = .833 x 5 = 4.17 customers W = 1 / ( - ) = 1 / (30 – 25) = .2 hr = 12 min Wq= ρW = .833 x 12 min = 10 min © 2004 by Prentice Hall, Inc., Upper Saddle River, N.J. 07458
Why do we have to wait? Why do services (and most non-MTS manufacturers) have queues? • Processing time and/or arrival time variance • Costs of capacity – can we afford to always have more people/servers than customers? • Efficiency – e.g. scheduling at the Doctor’s office © 2004 by Prentice Hall, Inc., Upper Saddle River, N.J. 07458 © 1995 Corel Corp.
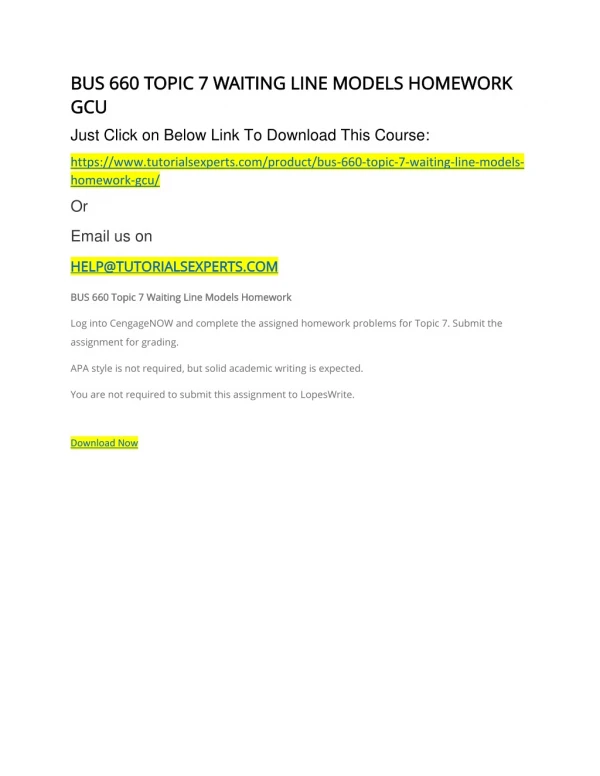
x Probability that Service Time t Time t Probability CUSTOMERS IN THE SYSTEM ARRIVALS(Poisson) n Probability SERVICE(Exponential) © 2004 by Prentice Hall, Inc., Upper Saddle River, N.J. 07458