Download
1 / 20

E N D
This is a deformation map of the south flank of Kilauea volcano on the big island of Hawaii, centered at 19.5 degrees north latitude and 155.25 degrees west longitude. The map was created by combining interferometric radar data -- that is data acquired on different passes of the space shuttle which are then overlayed to obtain elevation information -- acquired by the Spaceborne Imaging Radar-C/X-band Synthetic Aperture Radar during its first flight in April 1994 and its second flight in October 1994. The area shown is approximately 40 kilometers by 80 kilometers (25 miles by 50 miles). North is toward the upper left of the image. The colors indicate the displacement of the surface in the direction that the radar instrument was pointed (toward the right of the image) in the six months between images. The analysis of ground movement is preliminary, but appears consistent with the motions detected by the Global Positioning System ground receivers that have been used over the past five years
This X-band image of the volcano Kilauea was taken on October 4, 1994, by the Spaceborne Imaging Radar-C/X-band Synthetic Aperture Radar. The area shown is about 9 kilometers by 13 kilometers (5.5 miles by 8 miles) and is centered at about 19.58 degrees north latitude and 155.55 degrees west longitude. This image and a similar image taken during the first flight of the radar instrument on April 13, 1994 were combined to produce the topographic information by means of an interferometric process
Data acquired on April 13, 1994 and on October 4, 1994 from the X-band Synthetic Aperture Radar on board the space shuttle Endeavour were used to generate interferometric fringes, which were overlaid on the X-SAR image of Kilauea. The volcano is centered in this image at 19.58 degrees north latitude and 155.55 degrees west longitude. The image covers about 9 kilometers by 13 kilometers (5.6 miles by 8 miles)
This three-dimensional image of the volcano Kilauea was generated based on interferometric fringes derived from two X-band Synthetic Aperture Radar data takes on April 13, 1994 and October 4, 1994. The altitude lines are based on quantitative interpolation of the topographic fringes. The level difference between neighboring altitude lines is 20 meters (66 feet). The ground area covers 12 kilometers by 4 kilometers (7.5 miles by 2.5 miles). The altitude difference in the image is about 500 meters (1,640 feet). The volcano is located around 19.58 degrees north latitude and 155.55 degrees west longitude.
The image in the upper left shows L-band (horizontally transmitted and received) SIR-C radar image data for an area 34 by 59 kilometers (21 by 37 miles). North is toward the upper right; the radar illumination is from the top of the image. The bright areas are hilly regions that contain exposed bedrock and pine forest. The darker gray areas are the relatively smooth, sparsely vegetated valley floors. The dark irregular patch near the lower left is Lake Crowley. The curving ridge that runs across the center of the image from top to bottom is the northeast rim of the Long Valley Caldera, a remnant crater from a massive volcanic eruption that occurred about 750,000 years ago.
Mt. Vesuvius, one of the best known volcanoes in the world primarily for the eruption that buried the Roman city of Pompeii, is shown in the center of this radar image. The central cone of Vesuvius is the dark purple feature in the center of the volcano. This cone is surrounded on the northern and eastern sides by the old crater rim, called Mt. Somma. Recent lava flows are the pale yellow areas on the southern and western sides of the cone. Vesuvius is part of a large volcanic zone which includes the Phalagrean Fields, the cluster of craters seen along the left side of the image. The Bay of Naples, on the left side of the image, is separated from the Gulf of Salerno, in the lower left, by the Sorrento Peninsula. Dense urban settlement can be seen around the volcano. The city of Naples is above and to the left of Vesuvius; the seaport of the city can be seen in the top of the bay. Pompeii is located just below the volcano on this image.This image was acquired on April 15, 1994 by the Spaceborne Imaging Radar-C/X-Band Synthetic Aperture Radar (SIR- C/X-SAR) aboard the Space Shuttle Endeavour. SIR-C/X-SAR
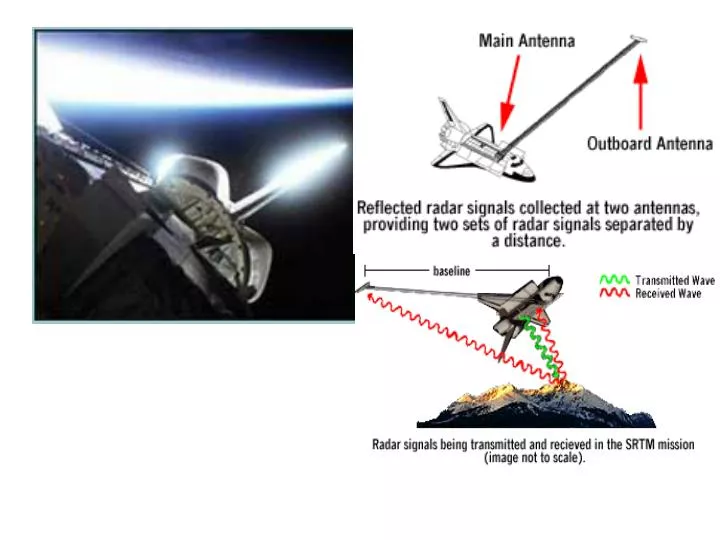
Panoramica sulla missione SRTM Introduzione all'esperimento La missione SRTM (Shuttle Radar Topography Mission) è dedicata all’osservazione della Terra dallo spazio ed è una missione realizzata in collaborazione tra la NASA, il Dipartimento della Difesa americano (DoD), la National Imaging and Mapping Agency (NIMA), l’agenzia Spaziale tedesca (DLR) e l’Agenzia Spaziale Italiana (ASI). La missione SRTM è stata progettata per usare versioni modificate delle antenne SIR-C e X-SAR, che sono già state oggetto di due precedenti missioni (SRL-1 e SRL-2 a bordo rispettivamente di STS-59 e STS-68), per mappare la topografia della superficie terrestre. Diversamente dalle recenti missioni, SRTM sfrutterà l’interferometria a singolo passaggio, cioè due immagini radar verranno acquisite contemporaneamente, una dall’antenna alloggiata nella stiva dello Space Shuttle e l’altra dall’antenna posta alla fine del traliccio di 60 metri che si estenderà dalla stiva. Combinando le due immagini si realizzerà una singola immagine 3D. Sia il SIR-C che l’X-SAR saranno modificati per operare come interferometri a baseline fissa con l’obiettivo di produrre, durante gli 11 giorni di missione, una mappa topografica digitale dell’80% delle terre emerse sulla Terra (tutte le terre emerse comprese tra 60° di latitudine nord e 56° di latitudine sud, come raffigurato in Fig.1) e con una spaziatura dei dati ogni arco-secondo di latitudine e di longitudine, cioè approssimativamente 30 metri. Le risoluzioni, orizzontale e verticale, saranno rispettivamente di 20 metri e di 16 metri.
Obiettivi della missione La missione SRTM ha l’obiettivo di realizzare i seguenti punti, durante gli 11 giorni di missione: Il più completo archivio digitale di immagini della Terra ad alta risoluzione. Questo si traduce in una mappa topografica digitale dell’80% delle terre emerse (cioè tutte le terre emerse comprese tra 60° di latitudine nord e 56° di latitudine sud, come raffigurato in Fig.1), con una spaziatura dei dati ogni arco-secondo di latitudine e di longitudine e con una accuratezza verticale relativa di 10 metri (accuratezza verticale assoluta di 16 metri). Dati sufficienti a produrre un mosaico in banda C dell’80% delle terre emerse con una risoluzione di 1 arco-secondo. Dati X-SAR per ottenere un’alta risoluzione verticale, ovvero 6 metri di risoluzione relativa e 16 di risoluzione assoluta.
Operazioni radar nominali Per soddisfare i requisiti della mappatura, SRTM dovrà collezionare dati su una "striscia" di almeno 225 Km. Per realizzare ciò sia l’antenna a bordo dello Shuttle che quella fuoribordo opereranno in modo SCANSAR con un miglioramento. Invece di una scansione a singolo fascio cross track, il SIR-C userà due polarizzazioni (HH e VV) per formare due fasci per ogni antenna. Quindi due delle quattro sotto-strisce saranno illuminate tutte le volte, come raffigurato. Questo modo di operare è chiamato SCANSAR a doppio fascio. In questo modo tutti e quattro i canali del SIR-C possono essere usati e la polarizzazione addizionale fornirà un modo di riserva a singolo fascio ad una risoluzione leggermente ridotta.
Immagine Radar a Media Risoluzione(MRI): i valori di grigio rappresentano l’ampiezza del segnale ricevuto dal radar; più forte è il segnale, più luminosa è l’immagine. Due immagini di questo tipo sono necessarie per produrre Interferogrammi
Interferogramma: i diversi colori rappresentano diversi valori di fase; più elevata è la variazione, più vicine sono le frange di interferenza. Le curve di livello possono essere ricavate dalle frange di interferenza.
Digital Elevation Model (DEM): è una rappresentazione punto per punto dell’altezza della superficie ottenuta dall’Interferogramma; l’altezza aumenta dal blu al rosso.
Nel DEM-3D si possono osservare i ripidi versanti delle montagne che possono però essere individuati anche dalla vicinanza delle frange di interferenza nell’Interferogramma. La stessa valutazione si può fare osservando i diversi colori del DEM.
L’immagine è relativa alla parte meridionale dell’Isola di Hokkaido in Giappone. La città sulla piccola penisola è Hakodate.
Interferogramma: i diversi colori rappresentano diversi valori di fase; più elevata è la variazione, più vicine sono le frange di interferenza. Le curve di livello possono essere ricavate dalle frange di interferenza.
Digital Elevation Model (DEM): è una rappresentazione punto per punto dell’altezza della superficie ottenuta dall’Interferogramma; l’altezza aumenta dal blu al rosso
Nel DEM-3D si possono osservare i ripidi versanti delle montagne che possono però essere individuati anche dalla vicinanza delle frange di interferenza nell’Interferogramma. La stessa valutazione si può fare osservando i diversi colori del DEM.
INTERFEROGRAMMA IMMAGINE SAR DEM 3D DEM