Download
1 / 17
170 likes | 305 Views
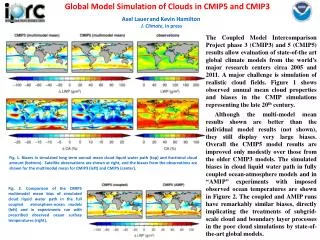
QA flagging of clouds and atmospheric anomalies Fast UV simulation tool - FastRT. Ola Engelsen Norwegian Institute for Air Research (NILU). CheckUVSpec. ShicRIVM. no. Too low?. Too high?. Snow/ Br.Cl?. yes. Flexstor Data. Compute bands. no. yes. no. yes. Print & Exit. no.

E N D
QA flagging of clouds and atmospheric anomaliesFast UV simulation tool - FastRT Ola Engelsen Norwegian Institute for Air Research (NILU)
CheckUVSpec ShicRIVM no Too low? Too high? Snow/ Br.Cl? yes Flexstor Data Compute bands no yes no yes Print & Exit no Cloud H2O no Aerosol OD Clear throughout? no Clouds? yes Cloudy throughout? yes yes no
Fastrt UV simulation tool • Few milliseconds running time • Accuracy comparable to UV measurements • Large variety of biological action spectra • Ozone • Slitfunction • Aerosol optical depth • Cloud liquid water column • Surface albedo / type • Broken clouds
FastRT error analysis • Clear sky:max 4%, mean error 1%, st. dev.1%. • Turbid sky: max 18%, mean 3%, st.dev. 4%. • Cloudy:max 35%, mean 8%, st. dev. 9%. • CheckUVSpec QA tests:max 1%.
Flexstor data extraction Extract following information: • Wavelengths • Irradiances • Slitfunction • Ozone column, if available • Snow cover info, if available • Location • Times • Compute solar zenith angles Check correctness of input QA-flagging
Compute bands • Add n irradiances band1 and band2 • The spectral location of band 1 and 2 depend on instrument, nominally 330nm and 390nm • If slitfunction is available n = 3, otherwise 9 QA-flagging
Too low? • Flag if band 2 irradiance is lower than simulation for very thick clouds (> 4000 g/m2) QA-flagging
Too high? Sun band 2 > thick trapping clouds above snow Thick cloud Thick cloud Clear sky downward total transmittance Snow QA-flagging
Snow/Broken Clouds? Snow + broken clouds > band 2 > Clear sky QA-flagging
Clouds? • Thick clouds < band 2 < cloudless @ 5km visib. QA-flagging
Clear throughout? No if: band1 / band2 < simulated (clearband1 / clearband2) QA-flagging
Cloudy throughout? No if: band1 / band2 > simulated (thick cloudband1 / thick cloudband2) QA-flagging
Cloud H2O? Search for cloud thickness scenario which best fits band 2 QA-flagging
Aerosol OD (optical depth)? Search for aerosol optical depth scenario which best fits band 2 QA-flagging
ShicRIVM QC/QA of solar spectral UV measurements and standardized spectral data-analysis 6 quality flags: • Shift_1 • Shift_2 • Start_irradiance • Spike+local_shape • Transmission_2 • Scan_variability_2 Code and documentation: ftp.rivm.nl:/outgoing/shicrivm www.rivm.nl/en/millieu/risicos_stoffen/nietioniserende_straling/shic QA-flagging