Download
1 / 43
450 likes | 689 Views
INVERSE PHOTOEMISSION: CB DOS Suggested Reading: F. J. Himpsel , “Inverse Photoemission from Semiconductors”, Surf. Sci. Rep. 12 (1990) 1-48 Process and Methods Applications: Graphene Practical Drawbacks and Advantages. Required Reading…. Photoemission+LEED+IPES/spin resolved.

E N D
INVERSE PHOTOEMISSION: CB DOS • Suggested Reading: F. J. Himpsel, “Inverse Photoemission from Semiconductors”, Surf. Sci. Rep. 12 (1990) 1-48 • Process and Methods • Applications: Graphene • Practical Drawbacks and Advantages
Required Reading…. Photoemission+LEED+IPES/spin resolved Band mapping, spin detection using synch. Rad+ PES/IPES
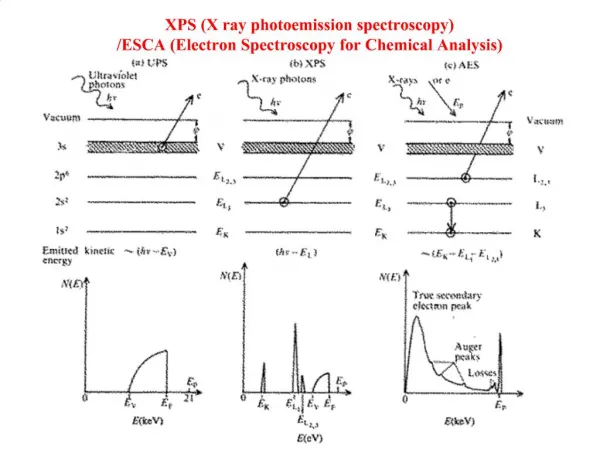
What about the empty states e- EF EB hv Photoemission allows us to interrogate Filled states of the system
Photoabsorption: --not surface sensitive --need high energy/flux source (synchrotron --NEXAFS (core π*) e- Hv(out) = E-ELoss E(loss) EF EB hv (in) E
e- e- out E = E- Eloss Electron energy loss (EELS) E(loss) EB e- in, E
PES and Inverse PES hv=9.7 eV, Geiger-Müller detector Direct and inverse photoemission www.tasc.infm.it/research/ipes/external.php Substrate-mediated assembly of doped graphene
Dowben Group Facility for spin-polarized inverse photoemission Dowben group uses photoelectrons from GaAs
Important Consideration of IPES: Low Count Rates (Himpsel) fine structure constant R = Rydberg Const. σ(IPES) ~ 10-8 photons/electron: cannot use intense ebeams (sample damage) σ(PES) ~ 10-3 electrons/photon: can use intense hv sources (synchrotrons) Bottom line: IPES is not for the impatient, or for unstable samples.
Himpsel: Fermi edge for Ta: resolution ~ 300 meV (~400 meV for Dowben group): Note Thermal Broadening
Mapping out the conduction band (k|| = 0) (adopted from Himpsel paper): note slight matrix element effects on intensities as Ei is varied
Growth of Graphite (Multilayer graphene) on SiC(0001)—Forbeaux, et al., PRB 58 (1998) 16396 LEED shows that Si evaporation leads to graphitization at ~ 1400 C.
Same transition followed with IPES (normal emission) Forbeaux, et al. Note formation of π* band
IPES at varying polar angles maps dispersion of CB states. Note lack of dispersion of π* band
Growth of Graphene/BN(0001)/Ru(0001) (Bjelkevig, et al. J. Phys. Cond. Matt. 22 (2010) 302002) CVD with C2H4 yields graphene overlayer ALD of BN monolayer on Ru(0001)
GRAPHENE CHARACTERIZATION STM dI/dV Data: DOS is graphene-characteristic Expt: HOPG VB CB Our data Shallow valley near Fermi level, 0 eV bandgap semiconductor Graphene/BN/Ru D. Pandey et al. / Surface Science 602 (2008) 1607–1613 Graphene is a zero band gap semiconductor C. Bjelkevig, et al. J.Phys. Cond. Matt. 22 (2010) 302002 1770.001
Raman 2D shows humongous red shift Strong charge transfer?
KRIPES: Graphene/BN/Ru vs. Graphene/SiC Data indicates BN Graphene π* Charge Transfer (0.12 e/Carbon atom!) σ* π* band is filled! EF EF ~2.5 eV I. Forbeaux, J.-M. Themlin, J.-M. Debever, Phys. Rev. B 58, 16396 (1998)
By looking at distance of a CB feature from the Fermi level, we can look at charge transfer between graphene and substrate n-type 0.07 e-/C atom n-type 0.06 e-/C atom graphene n-type e- p-type substrate e- n-type 0.03 e-/C atom No charge transfer (Forbeaux et al.) p-type 0.03 e-/C atom Kong, et al. J.Phys. Chem. C. 114 (2010) 2161
Graphene/MgO(111) : Angle integrated photoemission, and angle-resolved IPES cobmine to show a band gap ! (Kong, et al.) Why is the π below the σ feature in the VB, and the reverse in the CB ? Answer: at Many k-values, π is below σ angle integrated PES gives this result. At k=0, the π and π* are closer to EF than σ, σ*, so IPES yields this result. We could do ARPES (need synchrotron, really).
Conclusions: • IPES conduction band DOS—k vector resolved only • Minor Cross sectional effects • Time consuming, low count rates • ~Monolayer sensitive • PES+IPES can give accurate picture of VB, DOS, and Band gap formation PES: angle resolved or integrated • Spin-resolved versions of both IPES and PES possible.
PES, IPES and surface states of semiconductors Surface states of semiconductors can be used in reconstruction, or dangling bonds can have signficant effects—good or bad—in interfacial device properties. Surface states usually lie in the band gap—can be affected by dopants
IMPURITIES IN SEMICONDUCTORS –LECTURE II • Cox, Chapt. 7.1,7.2 • Feynman Lectures on Physics Vol. III, Ch. 14 • Britney Spear’s Guide to Semiconductor Physics (http://britneyspears.ac/lasers.htm) I. Impurities in insulators and Semiconductors, a closer look A.Types of Impurities B. Dopant Chemistry and ionization potential C. Dopant Effects on Fermi Level II. P-N Junctions and Transistors III. Doping-induced Insulator-Metal Transitions
Semiconductor Impurities CB e- e- luminescence n-type dopant electron trap Egap hv p-type dopant hole trap e- h+ VB Creates a hole in VB
Chung, et al., Surface Science 64 (1977) 588: Oxygen vacancies donate electrons into bottom of conduction band
Impurity Chemistry: How does that extra electron(hole) get into the conduction (valence) band? e- Si Si Si Si P+ Hydrogenic Model—An N-doner like phosphorous, in tetrahedral coordination, can be thought of as P+with a loosely coordinated valence electron in a Bohr-type orbit
Orbital diameter can include several lattice spacings Electron screened from P+ by dielectric response of the lattice (єL) “Ionization” corresponds to electron promotion to bottom of CB, not to vacuum Note: EVac – ECBM ~ Electron Affinity (EA) e- Si Si Si Si P+ • In hydrogenic model, therefore, V(r) = -e2/(4π єL єor) • єL = 12 for Si big effect! • Kinetic energy = p2/2m* m* = 0.2 me for bottom of Si CB • En (Bohr model) = -e4m*/(8єL2 єo2 h2 n2) n= 1, 2, 3, 4… • n = 1 binding energy of donor electron = .031 eV (calc) vs. .045 (exp)
ECBM Ed Intrinsic regime EF EVBM Saturation regime Temperature dependence of # of carriers (n) and Fermi level for an n-type semiconductor (see Cox, Fig. 7.3) n 1/T
Evidence indicates As in bulk-terminated surface sites. As sits on tip Uhrberg ,et al., PRB 35 (1987) 3945
Case Study: B-doped Si(111)(3x3) , Kaxiras, et al., PRB 41 (1990) 1262 Theory suggests B sits underneath Si sites
B (hole doped) broken bond surface states now empty, show up in IPES Undoped, singly-occupied surface states in both PES and IPES As (n doped) filled surface states only apparent in PES spectra See also, Kaxiras, et al., PRB 41 (1990) 1262
IPES and polarized Electrons --polarization of the valence of fundamental and technological interest. --Conduction band polarization also important
Spin polarized inverse photoemission and photoemission Spin is conserved during inverse photoemisson e- Spin is conserved during photoemisson e-
e- e- electrons will not fall into states, and vice versa EF Real world intrusion: Typical electron sources have only partial polarization (P): P = [N - N]/[N+N] Typical figure ~ 30% (see Dowben paper).
e- e- EF By using spin up (down) electrons, we can map out the spin down (up) portions of the conduction band
Inverse photoemission maps out the spin states in the Fe(110) and Fe(111) conduction bands Santoni and Himpsel, PRB 43 (1991) 1305
How does surface structure affect the magnetic behavior of magnetic alloys? e.g., Ristoiu, et al. Europhys. Lett. 49 (2000) 624 Unit cell of NiMnSb --supposed to have very high polarization near Fermi level, but measurements inconsistent Could surface composition affect this? Combine spin integrated photoemission with spin-resolved inverse photoemission to find out. Why this combo: spin-integrated photoemission, spin resolved IPES?
Ristoiu, et al. MOKE and LEED data for NiMnSb(100) film Easy axis of magnetization <110> Spin integrated PES used to determine surface composition Surface is Sb-rich
Removal of excess surface Sb enhances spin polarization near Fermi level More sputtering and annealing stoichiometric Clean, excess Sb P
NiMnSb conclusions --surface magnetization very sensitive to surface structure --surface prep therefore critically impacts MTJ performance --Need to correlate surface compostion with electronic and magnetic structure.
Summary Inverse Photoemission Conduction Band DOS Can be used in spin-polarized manner spin polarized electrons Typically need other surface methods (AES, PES, LEED….) to monitor surface composition.