Download
1 / 19
190 likes | 316 Views
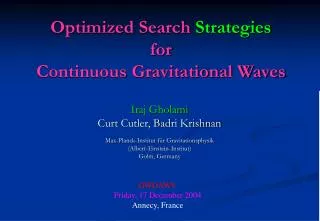
All-Sky broad band search for continuous waves using LIGO S2 data. Yousuke Itoh 1 for the LIGO Scientific Collaboration 1 Albert-Einstein-Institute, Golm, Germany. G040535-00-Z. S2 Frequentist coherent search. For S1: set upper limit on a single known pulsar

E N D
All-Sky broad band search for continuous waves using LIGO S2 data Yousuke Itoh1 for the LIGO Scientific Collaboration 1Albert-Einstein-Institute, Golm, Germany GWDAW-9 Annecy G040535-00-Z
S2 Frequentist coherent search • For S1: set upper limit on a single known pulsar • Targeted search (J1939+2134), ~ 2 weeks data • 95 % UL: 2e-21 (GEO), 2.7e-22 (L1), 5.4e-22 (H1), 4e-22 (H2) (Phys. Rev. D 69 082004,2004) • For S2: perform a wide parameters-space search • All-sky search: ~ 3e4 sky templates • Wide frequency band: 160-460 Hz • Set an upper limit on each 1 Hz band • Coincidence analysis between two IFOs • 10 hours goodsensitivity data • Templates without spin-down maximum spin-down 2.5e-11 Hz/s. GWDAW-9
S2 Frequentist coherent search • For S2: perform a wide parameters-space search • Computational cost Tobs = 10 hours data Given a F statistic value (Jaranowski, Królak, and Schutz Phys. Rev. D58 063001 (1998)), assuming it equals to the optimal signal to noise ratio defined in the JKS paper, the corresponding strain h0 of a signal averaged over the sky position and the nuisance parameters is: Correspondingly to this <h0>, the visible distance to a pulsar having ellipticity=1e-5, signal frequency=300 Hz, is 27 pc . • Practically, our aims are to establish a search pipeline, develop various techniques and solve problems arising during implementation(s) and tests of the pipeline in the application of it on the real data. GWDAW-9
1 1 S2 Search Pipeline This pipe line is executed on each 1 Hz band 1 S2 10 hours data GWDAW-9
2 2 2 Compute F stat. over bank of filters and frequency ranges. store results above threshold. S2 Search Pipeline This pipe line is executed on each 1 Hz band GWDAW-9
3 Take a pair of candidates from two IFOs. Ask if the pair is coincident in the parameters space. Any candidate events in the step 2 that can not find a coincident pair in the step 3 will be rejected. 3 S2 Search Pipeline This pipe line is executed on each 1 Hz band GWDAW-9
4 Take a coincident pair generated in the step 3. If either or both of the two events in the pair are loud-enough, perform a chi-square test on the event(s). If either failed the test, reject the pair. Otherwise keep the pair as a coincident candidate. S2 Search Pipeline This pipe line is executed on each 1 Hz band 4 GWDAW-9
h095% x x x x x x x x x x x x x x | | | f0 160 161 ………………….460 We have one such collection for every 1 Hz BAND GWDAW-9
New in S2: Data selection • computed the average Sh on 10 hours of data, every 30 minutes, when possible. • constrain: the spanned observation time must not greater than 13 hs • did this in various bands • took the 10 hours stretch for which the average over the different bands is smallest • H1: most sensitive 10 hours stretch over 11.14 hours starting @ 733200050 • L1 : most sensitive 10 hours stretch over 12.76 hours starting @ 732490940 • Note: we don’t care that the observations be simultaneous. We can do coincidences between data sets taken at different times. GWDAW-9
Distribution of F statistic: running mean <Sh> Sh Dist. of F: running median<Sh> Frequency in Hz New in S2: Noise power spectrum Distortion in PDF Theoretically expected PDF for white Gaussian. Observed noise PDF 2F • Mean Outliers affect <Sn> much and F statistic does not follow the chisquare distribution. • Median Outliers affect <Sn> little • and F stat. follows the chisquare dist. GWDAW-9 2F
Threshold on 2F 2F Frequency (Hz) Single candidate event New in S2: Frequency domain cluster identification At a fixed R.A. and Dec. Injected Signal Zoom up • If the frequencies of two peaks are less than df Hz apart, they are considered to consist of a single candidate event. • df = 1.4e-4 Hz by MC. GWDAW-9
Simulated pulsar signal veto signal New in S2: F statistic shape veto Injected damped sinusoid 2F veto signal Frequency in Hz • Procedure • Generate a veto signal from MLE parameters of the candidate (outlier). • Compare the profiles of the outlier and the veto signal. • Reference: GWDAW8 Class. Quant. Grav. 21 S1667, 2004 GWDAW-9
New in S2: Grid in the parameters space 100 % Cumulative probability distribution of loss in F • Equal spacing in frequency and pseudo isotropic grid for the sky template. • Spacing in frequency, R.A, Dec. are determined by Monte Carlo: % of the trials with loss < x value 5 % loss 2 % loss 0 % 0 (Loss in F) = 1 – Fobs/Fmax • df = 1/8/(10 hours) Hz • grid spacing = 0.02 radians both in R.A. and Dec. at the equator • Then, maximum loss in F = 5 % for LLO and 2 % for LHO, • 99 % of the MC trials, loss in F is less than 2 % for LLO and 0.5 % for LHO. GWDAW-9
New in S2: Coincidence analysis • If a candidate event in one IFO are less than a certain distance in the parameters space away from a candidate event in the other IFO, these two candidate events are coincident. Significance of an event = False Alarm rate “Joint significance” of a coincident events pair LLO i and LHO j • Loudest coincident event: • = the coincident event having the smallest Joint significance • Set an upper limit based on the loudest coincidence event event in each 1 Hz band. GWDAW-9
2F All sky color map (LLO) 2F All sky color map (LHO) Declination Declination Right Ascension Right Ascension Pulsar signal software injection Signal f = 247. 3456789 Hz R.A. = 3.456789 Dec. = -0.56 Loudest LLO Only f =247.345819 Hz R.A.= 3.446 Dec.= -0.571 2Fmax=812.2 Loudest LHO Only f =247.344903 Hz R.A.=3.494 Dec.=-0.571 2Fmax=146.1 GWDAW-9
2F Contour plot near the injected signal Loudest coincident pair Dec. from -0.61 to -0.47 radians R.A. from 3.41 to 3.58 radians Coincidence analysis (cont’d) Coincidence window df=0.001 Hz (Angular distance)=0.028 rad. (one grid spacing) LLO Loudest Coincident Loudest f =247.345819 Hz 247.345819 Hz R.A.= 3.446 3.446 Dec.= -0.571 -0.571 2Fmax=812.2812.2 LLO Loudest f =247.345819 Hz R.A.= 3.446 Dec.= -0.571 2Fmax=812.2 LHO Loudest Coincident Loudest f =247.344903 Hz 247.345354 R.A.=3.494 3.470 Dec.=-0.571 -0.571 2Fmax=146.1 145.72 LHO Loudest f =247.344903 Hz R.A.=3.494 Dec.=-0.571 2Fmax=146.1 Our (rather-restrictive-in-the-sky-location) coincidence-window gives us a better estimate of the signal sky location (at least for this example.) GWDAW-9
Upper limit statement • if a signal is injected in the data from a random source (uniformly located on the sky, in frequency and in nuisance parameters) with h0 = h095% (or greater), then in 95% (or greater) of the injections the signal produces at the output of our pipeline a more significant coincidence than the most significant event that we have found in the actual analysis. • It is in this sense that we say that h095% is the 95% confidence strain upper limit value for the population of astrophysical signals used in the injections. GWDAW-9
LHO data LLO data Pipeline i-th injection of a signal with parameters randomly chosen but fixed h0. i-th Joint Significance JSi Upper limit statement Monte Carlo injection loop i=1 to NMC • k = {Number of trials in which JSi is larger than the • observed joint significance • of the loudest coincident • event} • Compute p=k/NMC • h0 is the 100p % upper limit for the populations of the astrophysical signals used in injection. GWDAW-9
What we expect • Internal review and vetting of this search is not yet completed… • COINCIDENCES LOWER THE LOUDEST EVENT: • L1, 2F < 100: • Mean single loudest = 49.0 mean coincident loudest = 34.2 • H1, 2F < 100: • Mean single loudest = 45.7 mean coincident loudest = 34.5 • Based on the LIGO S2 noise curve, we expect the 95 % upper limit on the • strain to be about several 10^-23 in quiet bands and a few 10^-22 in noisy • bands. • NOTE: This analysis : 10 hours blind search, 95 % UL ~10^-22. • S1 : ~2 weeks targeted search, 95%UL ~ a few 10^-22. • Several techniques have been developed in parallel and will be used in • the future searches. • More elaborate coincidence window see Prix’s poster. • Metric based template placement • Code speed-up GWDAW-9