Download
1 / 63
630 likes | 791 Views
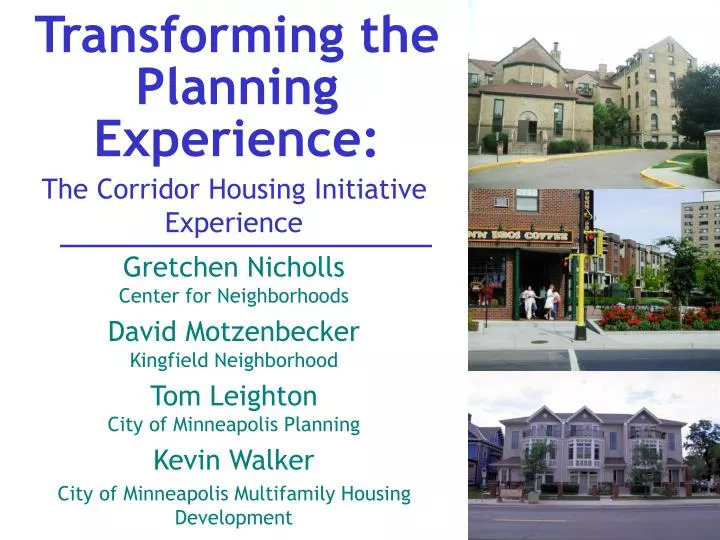
Transforming the Planning Experience:. The Corridor Housing Initiative Experience. Gretchen Nicholls Center for Neighborhoods David Motzenbecker Kingfield Neighborhood Tom Leighton City of Minneapolis Planning

E N D
Transforming the Planning Experience: The Corridor Housing Initiative Experience Gretchen Nicholls Center for Neighborhoods David Motzenbecker Kingfield Neighborhood Tom Leighton City of Minneapolis Planning Kevin Walker City of Minneapolis Multifamily Housing Development
Twin Cities Metropolitan Context (Seven-county area) • Metropolitan Council Framework becomes Blueprint • Focus is upon development in corridors within Metro Urban Service Area • Smart growth emphasis including 1/3 of growth in existing areas
Minneapolis needs more housing to accommodate growth CURRENT POPULATION Minneapolis: 382,618 Seven-county metropolitan area: 2,642,062 PROJECTED GROWTH Minneapolis: • By 2010: 19,250 more residents (9,650 households) • By 2030: additional 33,000 residents (24,600 households) (15% growth) Seven-county metropolitan area: • By 2010: 363,000 new residents (177,000 households) • By 2030: additional 603,000 residents (471,000 households) (36% growth)
Corridor Housing Concept • Corridors are Minneapolis’ “Main Streets,” reflecting the City’s historic street car routes. • Corridors are the physical pathways linking home, work, shopping, schools and parks. • High quality design can integrate increased density into the existing neighborhood fabric. • Affordable housing needs to connect to transit and jobs. • Minneapolis strives to create compact, walkable communities consistent with Smart Growth and TOD principles.
The Minneapolis Plan identifies key areas for housing intensification • Growth Centers • Downtown • Community Corridors • Commercial Corridors • Activity Centers • Major Housing Sites • Transit Corridors/ Station Areas Map: City of Minneapolis
Minneapolis Plan Community Corridors Key Characteristics: • Connect 3+ neighborhoods • 4,000-15,000 vehicles/day • Mostly residential uses • Small commercial corners • Traditional urban form Map: City of Minneapolis
Minneapolis Plan CommercialCorridors • Key Characteristics: • Major commercial/ retail • destinations • 20,000-30,000 vehicles/ day • Mostly commercial uses • Traditional urban form Map: City of Minneapolis
Minneapolis Plan Hiawatha Transit Corridor/Station Areas • Cedar/Riverside • Franklin Avenue • Lake Street/Midtown • 38th Street • 46nd Street • 50th Street/Minnehaha Park • VA Medical Center Map: City of Minneapolis
Corridor Housing Production Rental and Ownership Housing Starts * Only includes units receiving direct City financial assistance
Corridor Housing Production Affordability Levels
Minneapolis’ Corridor Housing Strategy (2003 – Present) • Minneapolis Plan identifying areas • Land assembly / acquisition funds • Alignment in allocation of City housing resources • Community outreach and interface (Corridor Housing Initiative)
Why the Corridor Housing Initiative? • Learning moment for the City: Creation of theDepartment of Community Planning and Economic Development (CPED) • Partnership with the City: Align City and neighborhood planning • Met Council projections: Need for 26,000 new housing units in Minneapolis the next 20 years • Role of neighborhoods and communities: Planning for growth
The Minneapolis Plan identifies areas for housing intensification • Growth Centers • Downtown • Community Corridors • Commercial Corridors • Activity Centers • Major Housing Sites • Transit Station Areas
Proactive Planning Partnerships Production
Goals and Outcomes 1. Demonstrate a replicable model of integrated planning among neighborhoods, the city, and the county • Build relationships • Engage the community in planning and development • Align community and city planning efforts 2. Produce viable development projects that include affordable housing options along corridors and meet city goals and neighborhood interests • Physically enhance neighborhoods • Develop housing that meets the needs of a range of incomes and enhances the neighborhood environment
Partners • Center for Neighborhoods • City of Minneapolis (Mayor, Council and CPED) • Family Housing Fund • Local Initiatives Support Corporation • Hennepin County • Minneapolis Public Housing Authority
Technical Team • Center for Policy, Planning and Performance • facilitation, citizen engagement, evaluation • Central Community Housing Trust - development • Metropolitan Design Center - design • Minneapolis CPED - policies, planning • Center for Neighborhoods - project management
Products • Building of community support and direction for development goals • Distillation of market viability for development objectives • Strategies for site acquisition andimplementation of development plans • Zoning overlays or adjustment to city land usepolicy • Commitment by the City to prioritize funding for development projects that emerge from the process
Housing Density Examples of density scaleMetropolitan Design Center
Mixed-Use Development Metropolitan Design Center
Corridor Housing Issues Metropolitan Design Center
Housing Types Metropolitan Design Center
New Affordable Housing in Minneapolis Metropolitan Design Center
13TH AVENUE Lake Street Sites B LAKE STREET A C A = Used Car Lot B = Spirit of the Lakes Church C = Bread Shop
Site AUsed Car Lot LAKE STREET Base site Expanded site 11th AVENUE
Site A View from Lake Street at 11th Avenue View toward Lake Street from 11th Avenue
Variables • Scenario 1 • Scenario 2 • Scenario 3 • Height • 2 story • 3.5 story • 3.5 story, expanded site • Units • 17 • 31 • 49 • % site green • 9% • 32% • 32% • % site paved • 36% • 14% • 14% • On ground parking • 17 • 0 • 0 • Below ground parking • 0 • 29 • 46 • # market rate rental • 9 • 16 • 25 • # affordable rental • 8 • 15 • 24 • Gain (loss) • ($205,054) • ($297,711) • ($215,487) • Gain (loss)/unit • ($12,062) • ($9,604) • ($4,398) Site A Scenarios Assumes land purchase/demolition at $20 per square ft.
Site A49-52 unit versions of scenario 3 Version 1 Version 2 Version 3: Participants’ design
Site BSpirit of the Lakes Church 13th AVENUE Base site Expanded site for cost purposes—although the bottom half was excluded from development by workshop participants LAKE STREET
Workshop group investigated options for both a base site and a larger one. • Options emphasized housing for GLBT seniors. • Development options building on the base site only—to save land costs--and with less commercial development were more cost effective as shown in Scenario 2 on the next page.
Variables • Scenario 1 • Scenario 2 • Scenario 3 • Height • 2 story • 3.5 story • 3.5 story, expanded site • Units • 22 • 39 • 75 • % site green • 8% • 18% • 27% • % site paved • 57% • 42% • 32% • On ground parking • 58 • 40 • 45 • Below ground parking • 0 • 43 • 77 • # market rate rental • 11 • 15 • 47 • # affordable rental • 7 • 24 • 28 • Gain (loss) • ($492,643) • ($51,652) • ($1,285,514) • Gain (loss)/unit • ($27,369) • ($1,324) • ($17,140) Site B Scenarios Assumes land purchase/demolition at $20 per square ft.
Site B: AIA Charette, February 200430 units of housing + church + parking (between Scenarios 1 and 2)
Site B: Development Workshop Scenarios Lake Street Top image shows expanded site which is not cost effective but has parking entry from rear and building that steps back at a rear plaza (68 units—close to scenario 3). Bottom image shows base site with building height reduced at rear to match existing neighborhood (39 units—close to scenario 2). Step back at rear Lower height at rear
Site B: Scenario 2 Options Version 3 Version 1 Views of two versions of building from front with step down height at rear Views of front and back of a version with step back to plaza at rear Rear view 3 Version 2
Issue: What is the objective and how do we measure effectiveness?
Sound Planning Objectives Community Preferences Development Feasibility
No Sound Planning Objectives Community Preferences Public Education
Goal: Public education on density and affordable housing Problem: How do you attract participation around this issue? • Make it voluntary • Add project goal: To foster development in CHI project areas
CHI—Two Goals • Public education re density, affordable housing • Fostering redevelopment in CHI project areas
Problem: How do we foster redevelopment? • Alignment is powerful • Keep it real (feasible) • Can we give preference for financial assistance to CHI project areas? No. • We do consider CHI participation in allocation of small site assembly fund
Sound Planning Objectives Community Preferences CHI Project Development Feasibility
CHI Lessons Learned—Objective Clarification and Effectiveness • Fosters redevelopment? Alignment is powerful. By itself it can yield developer interest. • Public education? Participation changes minds • Dual objectives has been confusing • Not all communities participate
Issue: How do we create a whole new layer of plans without overworking planning staff?
Related issue: To what degree do we customize the product/process vs. offer the same thing in different settings?
Plan Continuum (Green Book) 1. Comprehensive Plan 2. System Plans 3. Area Plans 4. Plans for Subsystem Components 5. Site plans (for public projects)
Plan Continuum (Green Book) 1. Comprehensive Plan 2. System Plans 3. Area Plans 4. Plans for Subsystem Components 5. Site plans (for public projects)