Download
1 / 33
330 likes | 489 Views
The Changepoint Approach to SPC. Douglas M. Hawkins, Peihua Qiu University of Minnesota Chang-Wook Kang Hanyang University. Background to SPC. Have stream of process readings X 1 , X 2 ,…X n ,…. Need to decide whether all follow common statistical model, versus

E N D
The Changepoint Approach to SPC Douglas M. Hawkins, Peihua Qiu University of Minnesota Chang-Wook Kang Hanyang University
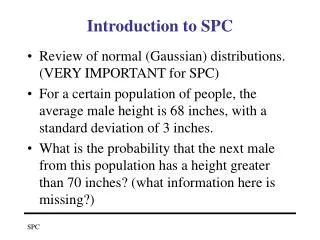
Background to SPC • Have stream of process readings X1, X2,…Xn,…. • Need to decide whether all follow common statistical model, versus • Isolated (transient) special causes (affect individual readings) or • Persistent special causes that remain until detected and fixed. Changepoint approach to SPC
The simplest statistical model • In control the Xn are iid N(m,s2) • Isolated special causes change mean and/or variance then revert. • Persistent special cause shifts the mean and/or variance. • For example, step change in mean m to m+d. Changepoint approach to SPC
Standard SPC methods • Shewhart Xbar and R/S chart used for isolated special causes. • Persistent causes need memory – cumulative sum (cusum) or exponentially weighted moving average (EWMA) chart. • For now we concentrate on latter. Changepoint approach to SPC
Designing a chart • An upward cusum is defined by where K is ‘reference value’ or ‘allowance. The chart signals a change if where H is the ‘decision interval’. Changepoint approach to SPC
The things you need to know • Cusum is the optimal way to detect step shift if K is halfway between in-control and out-of-control means. • So you must know m and d. • You decide H by setting acceptable in-control average run length (ARL). • To do this, you also need to know s. Changepoint approach to SPC
Who told you the Greek stuff? • Very rarely, you do actually know it. • More commonly, • do a Phase I study to estimate m and s, • carefully check data for control (can use fixed-sample-size methods for this) • pick a d big enough to matter, small enough not to be easy to see. Changepoint approach to SPC
An estimate is not a parameter • But sample estimates are not population parameters. • So you have a target ARL, but your actual ARL will be a random variable. • For sensitive methods like cusum with small K, EWMA with small l, resulting uncertainty in your ARL can be large. Changepoint approach to SPC
What cusum optimality? • On top of this, cusum is optimal only for shift it is tuned for. Get a much different shift, you lose performance. • Similarly for EWMA. Changepoint approach to SPC
The changepoint-in-mean model • For this model • Xi ~ N(m,s2) for i <= t ~ N(m+d,s2) for i > t • None of the Greeks is known a priori. • Suppose we are at observation number n. Changepoint approach to SPC
Likelihood approach • Write • If we knew changepoint was (say) k then MLE’s for m, m+d would be • s2 MLE would be Sk,n = (V0,k + Vk,n)/(n-2) (after the usual bias adjustment Changepoint approach to SPC
…. continued • Two-sample t for H0: d=0 (no change) is • Finally, estimate t as k maximizing |Tk,n| • And diagnose step change if Tmax,n > hn Changepoint approach to SPC
Phase II use • Changepoint formulation for fixed-sample (Phase I setting) is classical. • For Phase II SPC use n is not constant. Modify the procedure to: • If Tmax,n, < hn, diagnose in control, continue • If Tmax,n, > hn, conclude out of control.Use the MLE’s to diagnose time of change and pre- and post-change means. Changepoint approach to SPC
Getting the control limits • We need sequence of control limits hn. • Fixed-sample theory not much help. • A conceptual objective: Pick the hnso that Pr[Tmax,n > hn | no signal before time n] = a. • With such a sequence, in-control RL would be geometric (like Shewhart), and with • In-control ARL = 1/a Changepoint approach to SPC
How to get the hn • Big simulation: 16 million data sets. • Estimated hnfor several a values. • All on web site www.stat.umn.edu/hawkins Changepoint approach to SPC
So why have a Phase I? • Don’t need in-control parameter estimates, and so don’t need Phase I data gathering, • Can get up and running in Phase II. • As time goes by in control, ever-growing data base gives ever-better estimates (unlike conventional Phase I/II dichotomy) Changepoint approach to SPC
….continued • But most folk would ‘dry run’ at least some readings before turning on testing. • For lack of obvious best choice, suggest starting testing at n=10 (but Web tables give cutoffs for starts of n=3 through 21) • For example, for a=0.005: Changepoint approach to SPC
The 0.005 cutoff • The cutoffs seem to tend to around 3.2 • This corresponds roughly to the two-sided 0.001 point of a N(0,1) • This ‘Bonferroni multiplier’ of 5 is what you pay for the multiple testing. Changepoint approach to SPC
Do we need the Shewhart? • Changepoint formulation with a=0.005 compares latest X with mean of all previous data; this includes Shewhart I chart as one of its tests. Asymptotic cutoff of 3.2 is close to European standard. • and tests the newest mean against grand mean of all previous data; this includes Shewhart Xbar chart for rational groups of any and all sizes. Changepoint approach to SPC
How does method perform? • Compared to what? Methods that fix IC ARL with unknown parameters scarce. • Self-starting cusum doesn’t need IC parameter values. Also seamless from Phase I to Phase II. • Does however need size of shift for tuning purposes. Changepoint approach to SPC
A method comparison • Three cusums, k=0.25, 0.5, 1 • (tuned for shifts of 0.5, 1, 2 sd’s) • Two in-control ARL’s – 100, 500 • Shift occurring early (observation 10) or later (observation 100) • a: ARL 100, early; b: ARL 100, later • c: ARL 500, early; d: ARL 500, later Changepoint approach to SPC
Results • Changepoint is sometimes best. • Mostly is second best (no surprise, given cusum’s theoretical optimality). • Where not best, it is a close second best and has by far most robustly good performance. Changepoint approach to SPC
Example – triglyceride data • Data set kindly supplied by Dr. Dan Schultz, Rogasin Institute, New York. • Assay triglyceride standard every week. Use as a QC check on unknowns. Triglyceride reading should be constant (doesn’t much matter what its value is). • Here’s one year of data (given as I chart): Changepoint approach to SPC
Outlier? Upward shift at end? Changepoint approach to SPC
First clear exceedance is at week 40 Changepoint approach to SPC
What are estimates of the changepoint? Changepoint approach to SPC
and of the before- and after-change means Changepoint approach to SPC
Focus • Don’t interpret estimate of changepoint or of separate means in non-significant bit. • First signal is 5 weeks after apparent shift. • Pre-change mean estimate is 117 mg/dL • Post-change mean estimate is124 mg/dL • Right from first signal, all three estimates highly stable. Changepoint approach to SPC
Conclusions • Conventional Shewhart, cusum, EWMA calibrated assuming known parameters. • Random errors of estimation in parameters become systematic distortions in run distribution of any particular chart • making IC and OOC ARL’s random. • Ugly tradeoff between Phase I sample size and control over IC RL distribution. Changepoint approach to SPC
… • The unknown-parameter changepoint formulation lets you fix in-control run length distribution exactly, with or without sizeable Phase I sample. • Furthermore, interval alternative means performance competitive regardless of size of the shift. Changepoint approach to SPC
References Hawkins, D. M., Qiu, P., and Kang, C.-W. (2003) The Changepoint Model for Statistical Process Controlto appear in Journal of Quality Technology. Pollak, M. and Siegmund, D., (1991), 'Sequential Detection of a Change in a Normal Mean When the Initial Value Is Unknown', Annals of Statistics, 19, 394-416. Siegmund, D, (1985), Sequential analysis : tests and confidence intervals, Springer-Verlag, New York. Siegmund, D. and Venkatraman, E. S., (1995), 'Using the Generalized Likelihood Ratio Statistic for Sequential Detection of a Change-point', Annals of Statistics, 23, 255-271. Changepoint approach to SPC