Download
1 / 10
100 likes | 154 Views
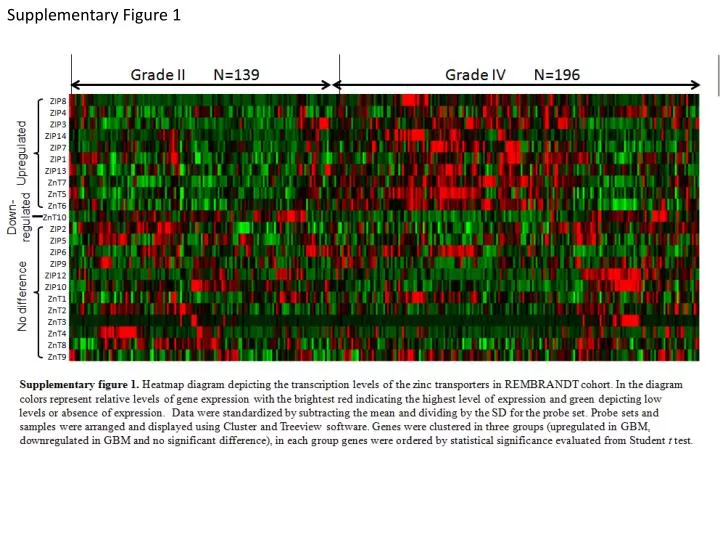
Supplementary Figure 1. Supplementary Figure 2. Supplementary Figure 3.

E N D
Supplementary Figure 3 Supplementary Figure 3. Kaplan-Meier analyses of overall survival according to ZIP3 expression level. Discriminative power of ZIP3 in CGCA cohort (A, B, C) and REMBRANDT cohort (D, E, F) were assessed with Kaplan-Meier plotting method and Log-rank test.
Supplementary Figure 4 Supplementary Figure 4. Kaplan-Meier analyses of overall survival according to ZIP6 expression level. Discriminative power of ZIP6 in CGCA cohort (A, B, C) and REMBRANDT cohort (D, E, F) were assessed with Kaplan-Meier plotting method and Log-rank test.
Supplementary Figure 5 Supplementary Figure 5. Kaplan-Meier analyses of overall survival according to ZIP7 expression level. Discriminative power of ZIP7 in CGCA cohort (A, B, C) and REMBRANDT cohort (D, E, F) were assessed with Kaplan-Meier plotting method and Log-rank test.
Supplementary Figure 6 Supplementary Figure 6. Kaplan-Meier analyses of overall survival according to ZIP9 expression level. Discriminative power of ZIP9 in CGCA cohort (A, B, C) and REMBRANDT cohort (D, E, F) were assessed with Kaplan-Meier plotting method and Log-rank test.
Supplementary Figure 7 Supplementary Figure 7. Kaplan-Meier analyses of overall survival according to ZIP10 expression level. Discriminative power of ZIP10 in CGCA cohort (A, B, C) and REMBRANDT cohort (D, E, F) were assessed with Kaplan-Meier plotting method and Log-rank test.
Supplementary Figure 8 Supplementary Figure 8. Kaplan-Meier analyses of overall survival according to ZIP11 expression level. Discriminative power of ZIP10 in CGCA cohort (A, B, C) were assessed with Kaplan-Meier plotting method and Log-rank test.
Supplementary Figure 9 Supplementary Figure 9. Kaplan-Meier analyses of overall survival according to ZnT8 expression level. Discriminative power of ZnT8 in CGCA cohort (A, B, C) and REMBRANDT cohort (D, E, F) were assessed with Kaplan-Meier plotting method and Log-rank test.
Supplementary Figure 10 Supplementary Figure 10. Kaplan-Meier analyses of overall survival according to ZnT9 expression level. Discriminative power of ZnT9 in CGCA cohort (A, B, C) and REMBRANDT cohort (D, E, F) were assessed with Kaplan-Meier plotting method and Log-rank test.