Download
1 / 15
150 likes | 153 Views
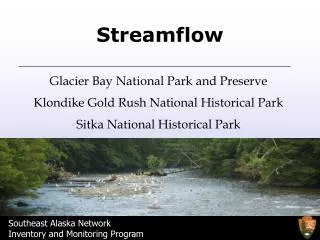
Modeling Source-water Contributions to Streamflow along a Stream-Lake-Stream Couplet in a Mountain Watershed. Christopher D. Arp Dept. of Biology and The Ecology Center Utah State University GIS in Water Resources term project - November 2002.

E N D
Modeling Source-water Contributions to Streamflow along a Stream-Lake-Stream Couplet in a Mountain Watershed Christopher D. Arp Dept. of Biology and The Ecology Center Utah State University GIS in Water Resources term project - November 2002
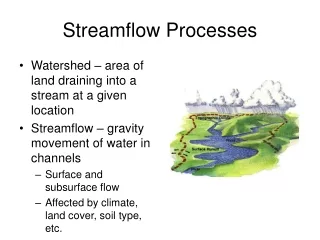
understanding and predicting how linkages between lakes and streams effect aquatic ecosystem structure and function • My Research: hydrologic controls on N cycling • hillslope-to-stream scale • stream-reach scale • watershed scale TOPMODEL GISWR termproject
surface runoff soil water Nitrogen Flux groundwater Watershed Hydrology (TOPMODEL) source-water volumes [V] Mixing Model CTVT = CsurfVsurf + CsoilVsoil + CgwVgw • surface runoff (surf) • soil water (soil) • groundwater (gw) Watershed Chemistry (endmember sampling) source-water concentrations [C] Time • Goals • Understanding: watershed processes and stream biogeochemistry • Application: land-use, aquatic ecosystems, & water quality
TERM PROJECT OBJECTIVES • Review of TOPMODEL applications for hydrochemical modeling • Acquire necessary data (input & validation) • Prepare DEM using TauDEM • Analysis of study catchments using tools in ArcGIS & TauDEM
INPUT DATA (spatial) Topography & Hydrography Digital Elevation Model (DEM) – 30 m USGS National Elevation Dataset http://edcnts12.cr.usgs.gov/ned Drainage Network National Hydrography Dataset http://nhd.usgs.gov/data.html Soils (porosity) County Soils Database (SSURGO) – NO DICE! http://www.ftw.nrcs.usda.gov/ssurgo_data.html State Soils Database (STATGO) – 1:250,000 NG! http://www.ftw.nrcs.usda.gov/stat_data.html
INPUT DATA (climate) • Temperature (daily) • on-site weather station (~ 2130 m) • Rainfall & • Snow Water Equivalents (daily) • NRCS SNOTEL STATION • (Banner Summit – 312) • http://www.wcc.nrcs.usda.gov/snotel/snotel • .pl?sitenum=312&state=id • Proximity: N44.30, W115.23 (~2150 m)
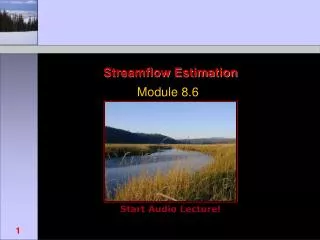
VALIDATION & CALIBRATION DATA (streamflow)
DEM PROCESSING STEPS • Project DEM & NHD datasets – UTM zone 11 • Fill Pits, D8 & Dinf Directions, & Contributing Areas • River Network Delineation • Compare NHD network to DEM generated network, • edit channel network and “burn-in” new network • Stream delineation and constant drop test • Add catchment outlets • Delineate catchments and subbasins • Calculate wetness index and flow path lengths
Network Discrepancy Edited Network
Raw Spatial Data TOPsetup Ready
What Next? • Get soils data • Determine which version of TOPMODEL • is best for this application • Run TOPsetup • (if Tarboton version of TOPMODEL is selected) • Determine appropriate submodels • for ET and snowmelt • 5. Run TOPMODEL and compare results • to empirical Q data • 6. Etc, Etc, Etc