Download
1 / 27
280 likes | 573 Views
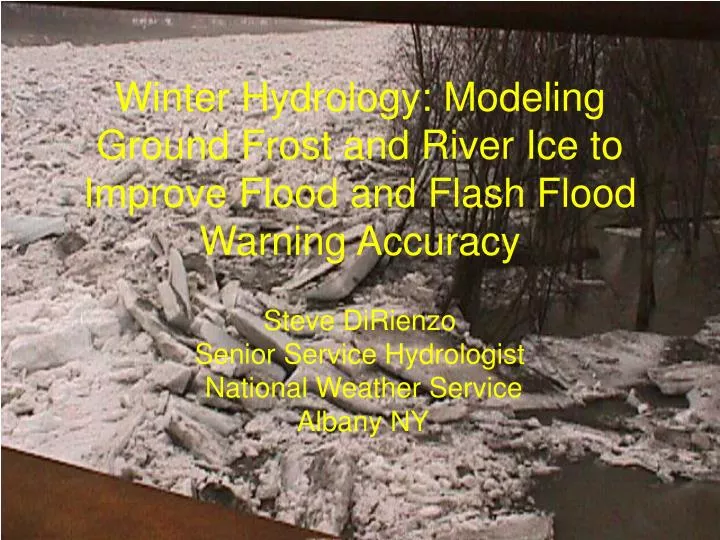
Winter Hydrology: Modeling Ground Frost and River Ice to Improve Flood and Flash Flood Warning Accuracy. Steve DiRienzo Senior Service Hydrologist National Weather Service Albany NY. OverView. Ice Jams Ground Frost. Ice Jams in Albany HSA. Ice Jams Occur in Preferred Locations

E N D
Winter Hydrology: Modeling Ground Frost and River Ice to Improve Flood and Flash Flood Warning Accuracy Steve DiRienzo Senior Service Hydrologist National Weather Service Albany NY
OverView • Ice Jams • Ground Frost
Ice Jams in Albany HSA • Ice Jams Occur in Preferred Locations • Bob Kilpatrick Catalogued Ice Jam Locations for WFO Albany • Question: Not Where, But WHEN
River Ice • Goal: Predict When River Ice Freeze Up and Break Up Jams Possible to Enhance Watch/Warning Lead Times and Accuracy
River Ice • When Are Freeze Up Jams Possible • Ice Thickness Equation • How Thick Does The Ice Need To Be For Break Up Jams? • When Does The Ice Break Up? • Case Studies
When Are Freeze Up Jams Possible • Freeze Up: Three Consecutive Days with daily average temperatures <= 0°F Tavg = (Tmax+Tmin)/2 • The Average Discharge During the Freeze Up Period Had Little Effect on the Formation of Frazil Ice Jams • Freeze Up Jams More Likely If Some Ice In Place Before Cold Snap • Can Use Representative MEX or MAV MOS Data To Issue Watch 24-36hrs Before Event http://aprfc.arh.noaa.gov/pubs/newsltr/pub4/frazil.html
Ice Thickness Calculation • Ice thickness in inches is estimated using the modified Stefan equation presented in USACE Manual(2002): ti = C (AFDD)0.5 • Constant C can range from 0.1 to 0.8 NWS Albany studies show C ~ 0.4 for KALY HSA (Bob K.) • Freezing Degree Day (FDD) = 32°F – Daily Average Temp (°F) • Thawing Degree Day (TDD) = Daily Average Temp (°F) – 32 °F USACE (2002) Engineering and Design: Ice Engineering. U.S. Army Corps of Engineers Engineer Manual 1110-2-1612.
How Thick Does The Ice Need To Be? • Around a Foot Thick or More – Ice Rigid Enough to Cause Jams • Estimations showed 11 Inches or More Were Enough to Jam • ~ 850-900 AFDD
When Does The Ice Break Up? • BUF Chart • Thanks Steve M.
When Does The Ice Break Up? • Accumulated Thawing Degree Hours (ATDH) has linear relationship to ice breakup • From previous chart: 240 ATDH/24 Hours • 240/24 >= 10 TDD/Day to cause breakup = Tavg >=42°F • Can use MEX, MEN or NDFD data to estimate date of breakup • Conversion to Thawing Degree Days (TDD) allows for coarse studies using daily data from previous years
Case Studies • Following case studies use data from nearest METAR station to jam location • Graph title shows nearest METAR (3-letter ID)
Case 1 – Predicted Breakup March 2nd, 2004 ti = 0.4 (AFDD)0.5 - Ice thickness set to zero when average daily temp >= 42°F
Case 3 – Predicted Breakup February 27th, 2000 ti = 0.4 (AFDD)0.5 - Ice thickness set to zero when average daily temp >= 42°F
Case 4 – Predicted March 16th, 2003 ti = 0.4 (AFDD)0.5 - Ice thickness set to zero when average daily temp >= 42°F
Ice Jam Watch/Warning Guidelines • Freeze Up: Three Consecutive Days with daily average temperatures <= 0°F (Observed or Forecast)? Freeze Up Jams Possible - Consider Flood Watch • Break Up: 1) Ice around 1 foot thick or more? And 2) Daily Average Temperature forecast to be >= 42°F or more? Break Up Jams Possible - Consider Flood Watch • Daily Average Temperature = (Tmax+Tmin)/2 • Forecasting ice jam potential for individual river basins is possible using the nearest MAV, NDFD or MEX MOS data.
Frost Depth/Frozen Ground • Anybody in the Northeast Measuring this? • Any thought to installing Frost Tubes or soil temperature probes? • Some Utility Companies and State Road Departments estimate/measure. Mainly to prevent frozen water pipes or estimate Frost Heave and winter/spring weight restrictions on roads.
Equation Used by Canadian Utility Company A Practical measure to prevent frozen water service lines - the Region of Ottawa Carleton's Experience, National Research Council Canada, 1999. Brown, W.G. Difficulties associated with predicting depth of freeze or thaw. Canadian Geotechnical Journal, 1(4):215-226, 1964.
Frost With Snow (Snow depth manipulation and its influence on soil frostand water dynamics in a northern hardwood forest (CRREL – 2001))
KALY Frost Simulations 0405: Flash Flooding January 14th 2005. A few inches of frost left on April 2 prior to record floods. Depth of Frost (m) = .0174(AFDD(°C))**.67 ***AFDD = AFDD + FDD/Snow Depth
Can Estimate When Soil Thaw Complete • To calculate the total number of thawing degree days until the thaw is complete, multiply the Winter Freezing Index (AFDD) by 0.3. • For example, for a Winter Freezing Index of 1375 °F AFDD, the Thawing Index would be 412 ATDD: 0.3 x 1375 = 412 • Ref: Wisconsin Transportation Bulletin No 8 November 2003
The End • Questions/Comments? • 2004 Cold Regions Hydrology Workshop – Section on Frozen Ground Modeling contains info/plans for Frost Gauges: • http://aprfc.arh.noaa.gov/resources/crw04/Agenda.htm