Download
1 / 14
140 likes | 160 Views
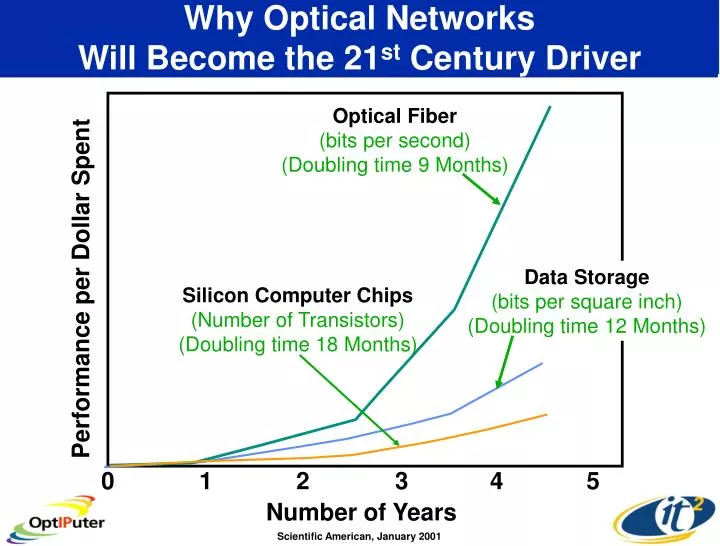
Why Optical Networks Will Become the 21 st Century Driver. Optical Fiber (bits per second) (Doubling time 9 Months). Data Storage (bits per square inch) (Doubling time 12 Months). Silicon Computer Chips (Number of Transistors) (Doubling time 18 Months). Performance per Dollar Spent. 0.

E N D
Why Optical NetworksWill Become the 21st Century Driver Optical Fiber (bits per second) (Doubling time 9 Months) Data Storage (bits per square inch) (Doubling time 12 Months) Silicon Computer Chips (Number of Transistors) (Doubling time 18 Months) Performance per Dollar Spent 0 1 2 3 4 5 Number of Years Scientific American, January 2001
Imagining a Fiber Optic Infrastructure Supporting Interactive Visualization--SIGGRAPH 1989 “What we really have to do is eliminate distance between individuals who want to interact with other people and with other computers.” ― Larry Smarr, Director National Center for Supercomputing Applications, UIUC ATT & Sun “Using satellite technology…demo of What It might be like to have high-speed fiber-optic links between advanced computers in two different geographic locations.” ― Al Gore, Senator Chair, US Senate Subcommittee on Science, Technology and Space http://sunsite.lanet.lv/ftp/sun-info/sunflash/1989/Aug/08.21.89.tele.video Source: Maxine Brown
The OptIPuter Project – Removing Bandwidth as an Obstacle In Data Intensive Sciences • NSF Large Information Technology Research Proposal • UCSD and UIC Lead Campuses—Larry Smarr PI • USC, UCI, SDSU, NW Partnering Campuses • Industrial Partners: IBM, Sun, Telcordia/SAIC, Chiaro, Calient • $13.5 Million Over Five Years • Optical IP Streams From Lab Clusters to Large Data Objects NIH Biomedical Informatics Research Network NSF EarthScope http://ncmir.ucsd.edu/gallery.html siovizcenter.ucsd.edu/library/gallery/shoot1/index.shtml
Interactive Visual Analysis of Large Datasets: Lake Tahoe Tidal Wave Threat Analysis Graham Kent, Scripps Institution of Oceanography 3 Megapixel Panoram Display Cal-(IT)2 Visualization Center at Scripps Institution of Oceanography http://siovizcenter.ucsd.edu/library/gallery/shoot1/index.shtml
OptIPuter End User Building Blocks:Scalable Compute + Storage + Viz Linux Clusters Commodity GigE Switch Fibers or Lambdas • Cluster: 16 – 128 Nodes (Typically Two Intel Processors) • Storage: 0.1-1 TB per Node • Graphics: Nvidia Card Per Node • Visualization Displays: Desktop, Wall, Theatre, Tiled, VR • Specialized Data Source/Sink Instruments • All Nodes Have 1 or 10 GigE I/O • Clusters Connected by Lambdas or Fibers
OptIPuter is Studying the Best Application Usagefor Both Routed vs. Switched Lambdas • OptIPuter Evaluating Both: • Routers • Chiaro, Juniper, Cisco, Force10 • Optical Switches • Calient, Glimmerglass, BigBangWidth • UCSD Focusing on Routing Initially • UIC Focusing on Switching initially • Next Year Merge into Mixed Optical Fabric Optical Switch Workshop October 2002
OptIPuter Software Architecture for Distributed Virtual Computers v1.1 DVC/ Middleware High-Speed Transport Optical Signaling/Mgmt OptIPuter Applications Visualization DVC #1 DVC #2 DVC #3 Higher Level Grid Services Security Models Data Services: DWTP Real-Time Objects Layer 5: SABUL, RBUDP, Fast, GTP Grid and Web Middleware – (Globus/OGSA/WebServices/J2EE) Node Operating Systems Layer 4: XCP l-configuration, Net Management Physical Resources Andrew Chien OptIPuter Systems Software Architect
The UCSD OptIPuter Deployment The Dedicated Optical Grid: OptIPuter Campus-Scale Experimental Network 0.320 Tbps Backplane Bandwidth Juniper T320 20X 6.4 Tbps Backplane Bandwidth Chiaro Estara ½ Mile To CENIC Forged a New Level Of Campus Collaboration In Networking Infrastructure SDSC SDSC SDSC Annex SDSCAnnex Preuss High School JSOE Engineering 2 Miles 0.01 ms CRCA SOM Medicine 6thCollege Phys. Sci -Keck Collocation Node M Earth Sciences SIO Source: Phil Papadopoulos, SDSC; Greg Hidley, Cal-(IT)2
OptIPuter 2004 @ UCSDCoupling Linux Clusters with High Resolution Visualization
OptIPuter Project Goal:Scaling to 100 Million Pixels • JuxtaView (UIC EVL) on PerspecTile LCD Wall • Digital Montage Viewer • 8000x3600 Pixel Resolution~30M Pixels • Display Is Powered By • 16 PCs with Graphics Cards • 2 Gigabit Networking per PC NCMIR – Brain Microscopy (2800x4000 24 layers) Source: Jason Leigh, EVL, UIC; USGS EROS
Multi-Latency OptIPuter LaboratoryNational-Scale Experimental Network Chicago OptIPuter StarLight NU, UIC USC, UCI UCSD, SDSU SoCal OptIPuter “National Lambda Rail” Partnership Serves Very High-End Experimental and Research Applications 4 x 10GB Wavelengths Initially Capable of 40 x 10Gb wavelengths at Buildout 2000 Miles 10 ms =1000x Campus Latency Source: John Silvester, Dave Reese, Tom West-CENIC
Chicago Metro-Scale OptIPuter Uses I-WIRE and OMNInet Fiber • Optically linking EVL and NU using I-WIRE and OMNInet Fiber • OMNInet is a 10GigE Metro-Scale Testbed • I-WIRE is a $7,500,000 State of Illinois Initiative Chicago UIC Source: Tom DeFanti, EVL, UIC
An International-Scale OptIPuter is Operational over the First Set of 76 International GE TransLight Lambdas European lambdas to US –8 GEs Amsterdam— Chicago –8 GEs London—Chicago Canadian lambdas to US –8 GEsChicago— Canada —NYC –8 GEs Chicago— Canada —Seattle US lambdas to Europe –4 GEs Chicago—Amsterdam –3 GEs Chicago— CERN European lambdas –8 GEs Amsterdam—CERN –2 GEs Prague—Amsterdam –2 GEs Stockholm—Amsterdam –8 GEs London—Amsterdam TransPAC lambda –1 GE Chicago—Tokyo IEEAF lambdas (blue) –8 GEs NYC—Amsterdam –8 GEs Seattle—Tokyo NorthernLight UKLight CERN Source: Tom DeFanti, EVL, UIC
The OptIPuter GeoWall2at Supercomputing ‘03 See the National Center for Data Mining Booth 2935 SC ‘03