Download
1 / 15

E N D
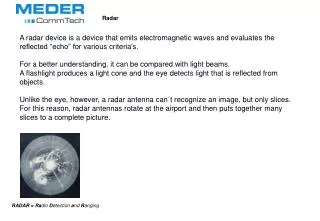
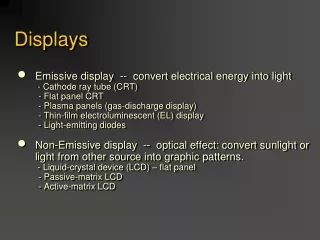
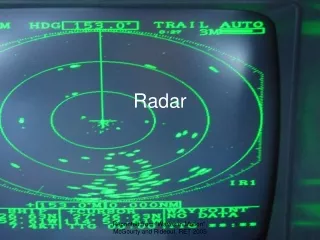
Radar Displays PPI - Plan position Indicator Maps the received signals on polar coordinates in plan view. The antenna scans 360° at fixed elevation angle. At every azimuth the voltage output of the receiver as a function of range is used to intensity-modulate a tube with polar coordinates (Rogers and Yau, 1989). This produces a plan view of the distribution of precipitation. Without careful calibration, PPI records are only useful to show the location and time occurrence of precipitation.
Radar Displays - cont. RHI - Range Height Indicator This display is generated when the antenna scans in elevation with fixed azimuth, thereby showing the details of the vertical structure of precipitation. CAPPI - Constant Altitude PPI Azimuth and altitude are varied systematically to survey region surrounding the radar site.
PPI RHI
Precipitation Processes Areal extent and lifetime of precipitation are largely controlled by vertical motions Customary to classify precipitation according to the dominant mechanism for the vertical motion Two major classifications 1. Widespread, stratiform continuous precip. associated with large scale ascent 2. Localized, convective showery precip. associated with cumulus-scale convection The distinction between the two is not always sharp. However, it is usually possible to describe a pattern as either markedly uniform (stratiform) or non-uniform (convective).
Stratiform Precipitation Example of a radar reflectivity pattern from a stratiform precip. event . (Fig. 11.1, Rogers, 1979) • evolves relatively slowly with time • usually associated with nimbostratus clouds • radar reflectivity (Z) pattern is relatively uniform • vertical air motion is weak • gravitational settling determines the Z pattern
Time-Height Pattern of Z and Doppler Velocity The contours I = 65 and 95 correspond to 30 and 0 dBz, respectively. (Fig. 11.2 Rogers, 1979; see Fig 12.5) • Doppler Velocity is constant with time and decreases upward • Z decreases upward and is constant with time. • Results from small raindrops near top of echo slowly falling through the cloud growing by coalescence.
Example of Radar “Bright Band” Doppler Velocity m/sec • “Bright Band” is located in a transition layer from snow to rain Reflectivity Height above ground (km) Doppler Velocity Reflectivity Factor DMZ PPI View at 8° elevation From Rogers, 1979; see Rogers and Yau, Fig. 12.3
Bright Band Explanation Bright Band is located in a transition layer from snow to rain. • Z increases because: Dielectric constant of water exceeds that of ice by a factor of 4.Melting produces distorted wet snow flakes with higher reflectivities than those of spherical drops. • Z decreases because: Raindrops fall faster than snowflakes; therefore their concentration in space is reduced, lowering Z. Note that the bright band is weak, diffuse or absent if there is convective overturning because mixing disrupts the stratification.
Showers • Echoes have lifetimes the order of an hour • Patterns evolve rapidly • Convection dominates the growth process • ~ the same horizontal and vertical dimensions Fig. 11.6 Rogers (1979)
Reflectivity Time-Height PatternWarm-Rain Shower Intensity I DMZ = 95 - I Fig 11.7a, Rogers (1979); Fig. 12.7 Rogers and Yau (1989) Height (km) Local standard time (hrs)
Stratiform Precipitation - Summary • Develop principally by the ice crystal process • Last a long time - several hours • Each level plays a distinct role Upper levels (T ≈ -20°C) supplies ice crystals Mid-levels (T ≈ -15°C) - rapid diffusional growth Low-levels - aggregation/accretion Useful approximation Stratiform rain is a steady state process in which cloud quantities may vary with height but are approximately constant with time at any given height.
Convective Clouds - Summary • High liquid water contents (wl) • Coalescence process dominates • Lifetimes are the order of 20 to 30 min • Precipitation begins early in the developing cloud at low levels • Initiation of precipitation may be by either the coalescence or ice-crystal process, but most growth is by accretion Useful approximation Showers are systems in which the cloud properties may vary with time, but they are (approximately) constant with height at any given time.
Horizontal Scales and Structure of Precipitation • Every precip area contains one or more of each smaller size • RLM ~ 2 RS; RSM ~ 2 RLM; RC ~ 2-10 RSM • Main contribution to total rainfall comes from the small and large mesoscale areas