Download
1 / 22
220 likes | 345 Views
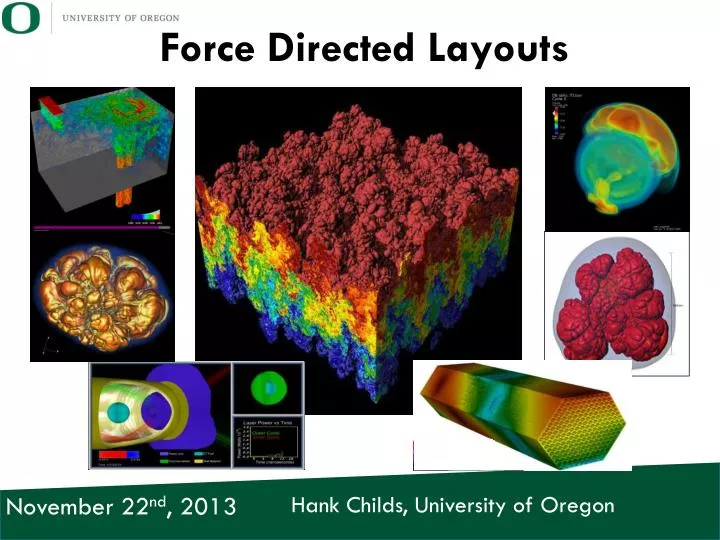
Force Directed Layouts. Hank Childs, University of Oregon. November 22 nd , 2013. Upcoming Schedule. 11/21: alternate lecture #1 (force directed layouts) 5pm , Deschutes 220 11 / 22 : uncertainty visualization (KP ) 12/2: alternate lecture #2 (force directed layouts) 2pm , HEDCO 142

E N D
Force Directed Layouts Hank Childs, University of Oregon November 22nd, 2013
Upcoming Schedule • 11/21: alternate lecture #1 (force directed layouts) • 5pm, Deschutes 220 • 11/22: uncertainty visualization (KP) • 12/2: alternate lecture #2 (force directed layouts) • 2pm, HEDCO 142 • 12/4: medical visualization (Erik Anderson) • 12/6: unstructured grids • Faculty fireside (parallel visualization): • Week of 12/2 or week of 12/9 • Final: Thurs 12/12, 3:15PM, Rm 220
Undirected graphs • G = (V, E) • V: set of vertices • E: set of edges, (a,b), where a,b in V • Possible: weights • Weights on edges • Weights on vertices
Inspiration: LinkedIn Maps Positive aspects: Related nodes are near each other Aesthetically pleasing Is this a good graph? Why or why not?
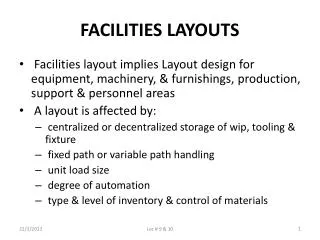
Aesthetic Considerations • Crossings – minimize towards planar • Total edge length – minimize towards proper scale • Area – minimize towards efficiency • Maximum edge length – minimize longest edge • Uniform edge length – minimize variance • Total bends – minimize orthogonal towards straight-line Slide c/o: R. Maciejewski, ASU Some details from this slide borrowed from John Stasko’sGraph lecture: http://www.cc.gatech.edu/~stasko/7450/Notes/graph1.pdf
What is the source data? • LinkedIn: • I send you a LinkedIn request, or you send me a LinkedIn request. • Data: • a list of people • a list of people they are connected to • LinkedIn Maps: • only consider connections to my connections • if I am connected to person X, and they are connected to Y, and I am not connected to Y, then just ignore Y
How is LinkedIn data converted to graphs? • Let P be the list of my connections • I have an edge to every one of my connections • (hank, q) for all people q in P • Create edge (x,y) if x and y are in P and x is connected to y • Edge weights: number of shared connections between x and y (“Good” = related nodes close to each other, aesthetically pleasing) Given data like this, how can we make a “good” graph?
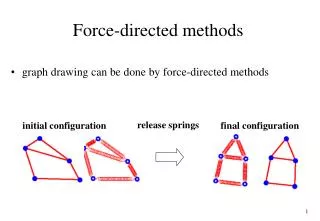
Force-directed layouts • Common information visualization algorithm • Not clear this is the algorithm LinkedIn Maps is using • Still graph G = (V, E), vertices V, edges E • Still edge weights on E • Goal: edges are more or less of equal distance, as few crossing edges as possible
Force-directed layouts: idea • Two competing forces: • Edges become springs • pull vertices together • Hooke’s law • Vertices become electric particles • push vertices apart • Coulomb’s law
Force-directed layouts: idea • Place vertices in random initial position • Iteratively change vertex positions based on forces • This iterative process ultimately converges, in a way that minimizes energy (over both spring & electric repulsion) • If it doesn’t converge add dampening factor • The final position of the vertices is the force-directed layout
Interactivity Use Cases • Watching the graph converge • Modifying a graph after convergence • Just modify layout • http://bl.ocks.org/mbostock/1062288 • Associate two vertices together more closely • Set constraints (sticky layout) • http://bl.ocks.org/mbostock/3750558
Force-directed layouts: problem • Updating vertex v_i requires considering forces from v_1, v_2, … v_n, as well as all edges incident to v_i. • Result is O(n^2) work per iteration • Number of iterations estimated as O(n) • Total work is O(n^3) This becomes very expensive when n > 1000
Algorithms for improved performance • Overlaps with physics: n-body particle equations • Multiple approaches • Barnes-Hut • When considering one vertex, minimize # of other vertices considered • Drops to O(n*log(n)) per iteration, O(n^2*log(n)) overall • Depends on quadtree data structure
Octree • Source: wikipedia
Quadtree • Source: wikipedia
Barnes-Hut • Divide graph into quadtree • Iterate over each vertex. • Do NOT consider Coulomb effects for all other vertices • Instead: • group vertices in distant quad tree cells together • consider these vertices as a single vertex (with a higher mass) • less vertices considered Intuition on why this works: the close ones are most important and they are still considered individually
Gephi • Gephi: open-source network analysis and visualization software package • Maintained by French non-profit (Gephi Consortium) • Written in Java on the NetBeansplatform • Example usages: • Twitter network traffic • Network analysis We will look at relationships in “Les Miserables” using data set compiled by Donald Knuth.
Les Miserables Movie Jean Valjean Cosette Javert Fantine Marius Thenardiers + many others, including revolutionaries, priests & nuns, prisoners, criminals, policemen
Demonstration • (Now Gephi demonstration with Samuel Li)