Download
1 / 29
290 likes | 427 Views
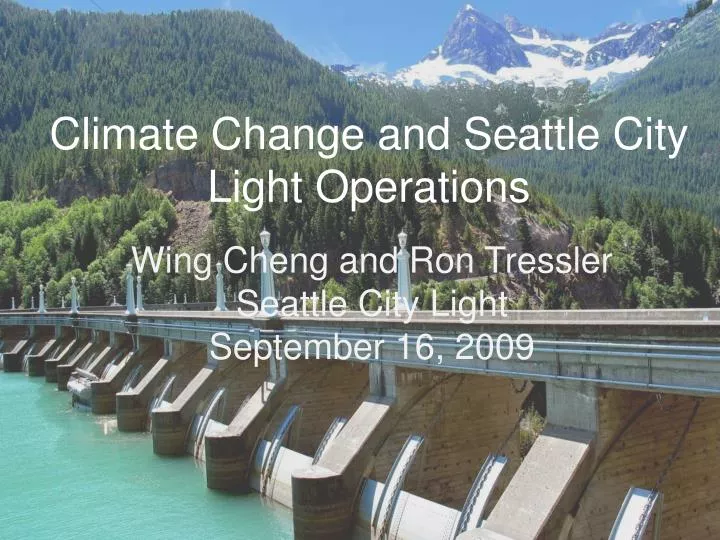
Climate Change and Seattle City Light Operations. Wing Cheng and Ron Tressler Seattle City Light September 16, 2009. Presentation Outline. Background on Seattle City Light Climatic Effects on Hydrology and Operations Potential Impacts Power Generation Power Delivery Power Management

E N D
Climate Change and Seattle City LightOperations Wing Cheng and Ron Tressler Seattle City Light September 16, 2009
Presentation Outline • Background on Seattle City Light • Climatic Effects on Hydrology and Operations • Potential Impacts • Power Generation • Power Delivery • Power Management • Asset Management • Moving Forward City of Seattle
Seattle City Light Facts • Municipal Electric Utility • 376,000 customers • About 90% hydro • Skagit River – 711 MW capacity • Boundary (Pend Oreille River) – 1,047 MW capacity • Carbon Neutral for last 5 years • Skagit is certified Low Impact Hydro City of Seattle
Canada United States Ross Dam
Climate Change in the PNW • Temperatures: 1.5°F (1920 and 2003) • Precipitation: 14% (1930-1995) • April 1 SWE: 25% in Washington Cascades • Runoff Timing: Shifted 0-20 Days Earlier • Following Charts Shows Climate Change in the Skagit Watershed as observed by SCL • Source: CIG website City of Seattle
Note: More than 1 Deg. F increase in January, February and July City of Seattle
Note: An annual decrease of about 1/3 inch City of Seattle
Climate Change Impacts Detected • Reduced spring-summer inflow PDO Positive PDO Negative No official PDO Classification
An 14.5% annual reduction and an 18.2% May-July reduction. City of Seattle
City of Seattle Note: Trends of runoffs shifting to earlier starts and ends
City of Seattle Power Generation • Skagit Project Managed for “Fish First” • All Pacific salmonid species • Listed Chinook salmon, steelhead, and bull trout • Intricate annual flow management planning with monthly updates • Protect salmonids during spawning and fry development • Meet Corps flood control mandates and recreation pool elevations in Ross Lake
Power Generation • Model Skagit Hydrology based on the following: • 3Tier’s DHVSM Water Years 86-03 • Temperature +2.7oF by 2020 and +4.1oF by 2040 over 1990-1999 • Precipitation Unchanged • Output is Reservoir Inflow • Optimize Ross Reservoir Outflow based on Inflow Data City of Seattle
More power will be generated during winter and less during spring and summer City of Seattle
Skagit River Fisheries Increased frequency of extreme events High-flow events scouring redds and rearing habitat Thermal barriers during low flows
Power Management Peak Load in winter (California Summer) Surplus Power in Summer (California Winter) SCL Owned Generation Only – BPA and Other Power Contracts not Included, e.g. in 2007, SCL Generated 48.3% and Purchased 42.3% from BPA Power Exchange with California City of Seattle
Power Management…..continued • California Load-Resource Change Currently Lacking for Understanding • SCL Load-Resource Change Slight Load Decrease in Winter and Increase in Summer • SCL Adaptation Strategies Explore Exchange with Other Regions Expand Sales and Purchases in Spot Market Develop Prudent Hedging Strategies Improve System Load Forecast City of Seattle
Cooling Load on 07/29/09 Heat Wave City of Seattle
Uncertainty in System Load Modeling 2020 Hourly Peak Load = 1765.5 MW 2020 6-Hours Peak Load = 2175 MW City of Seattle
Power Delivery • Transmission/Distribution Line Rating + 5o F on 1000’ span = 2’’ more Sag Not Significant Now; but Could be at + 10o F • Transformer Thermal Rating Aging Acceleration Factor = 1 with Hottest Spot at 110o F Insulation Deterioration Rate Doubles every 7o F Increase Water Spray Now Required During Very Hot Days De-rate or Replace with Increasing Hot Days? City of Seattle
Healey Fire Protection – Outdoor Transformer Protection with Water Spray System City of Seattle
Asset Management • Normal Period for Plant Maintenance Heavy Glacial Runoff Downstream Possible Loss of a Month City of Seattle Slide 13
Asset Management…..continued • Decision on Capital Investments Example of Gorge Second Tunnel Three 30-MW Units Completed in 1929 A 4th 67-MW Unit Added in 1951 One 20.5’ Diameter, 11000 Feet Long Tunnel Tunnel Loss at Full Capacity about 60 Feet or 34 MW City of Seattle
New 18 Feet Diameter Tunnel to Supply Water to the Large Unit Only Recover Slightly More Than Half of Tunnel Loss at Full Capacity Annual Reduction in Tunnel Loss Enough to Power over 7000 Households City of Seattle
Climate Change May Favor this Project but What About Others? City of Seattle
Moving Forward • Expand Conservation Program (12 aMW in 2009) • Purchase power to meet I-937 renewable energy portfolio requirement • Adapt hydroelectric project operations to changing conditions (cannot solely use historical data) City of Seattle
Research and Next Steps • Improve River Flow Forecasting • Track Frequency and Timing of Floods • Need Improved Downscaling of Global Climate Models – Dynamic and Statistical Methods • Gain Additional Understanding of Glacier Melting Patterns • Continue to Monitor Impacts on Fisheries City of Seattle