Download
1 / 13
130 likes | 327 Views
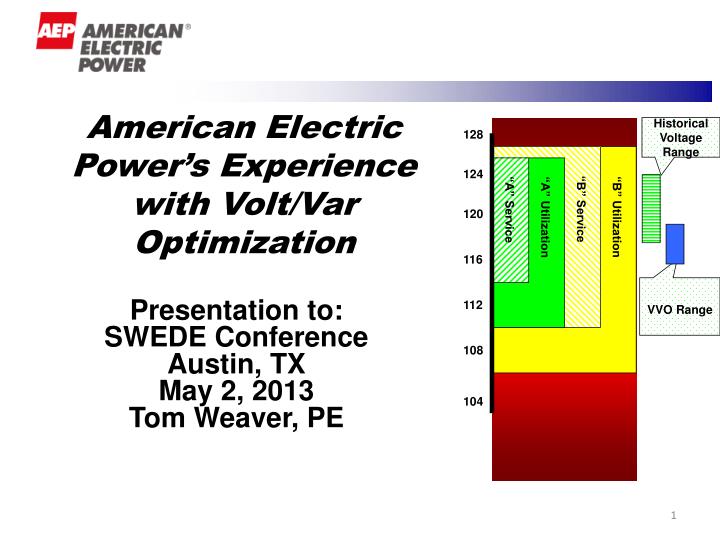
Historical Voltage Range. 128. American Electric Power’s Experience with Volt/Var Optimization. 124. “B” Service. “A” Service. 120. “A” Utilization. “B” Utilization. 116. VVO Range. 112. Presentation to: SWEDE Conference Austin, TX May 2, 2013 Tom Weaver, PE. 108. 104.

E N D
Historical Voltage Range 128 American Electric Power’s Experience with Volt/Var Optimization 124 “B” Service “A” Service 120 “A” Utilization “B” Utilization 116 VVO Range 112 Presentation to: SWEDE Conference Austin, TX May 2, 2013 Tom Weaver, PE 108 104
Volt VAR Impacts on Customer’s Motors kVAR ↓ ~ 20% Real Power consumption is 8% lower @ 115V than at 125V kW ↓ ~ 8%
Volt VAR Optimization Architecture Volt VAR Controllers MeshMaster EOL Monitors Mesh Network Line Regulators Line Capacitors Fiber or Mesh DMS - GENe 3
AEP’s Volt / VAR Optimization Technology Deployments AEP Ohio : 17 circuits in service Additional circuits being considered to meet EE State Targets Indiana & Michigan Power Co.: 9 circuits in service Planning to include VVO as an EE Program Public Service Company Oklahoma : 11 circuits in service Kentucky Power Co. : 25 circuits going in service in 2013 Planning to include VVO as an EE Program
AEP Ohio: Gahanna – 4505 Voltage Profile CAP 2 REG CAP 3 EOL 2 Substation Without AdaptiVolt™ = 6-7-11 @ 4:30 pm With AdaptiVolt™ = 6-6-11 @ 4:30pm Flatter voltage profile, lower voltage, reduced tap changer operations 5
AEP Ohio: East Broad 1406 Voltage Profile EOL 55 REG 2 CAP 4 CAP 3 CAP 1 CAP 2 REG 1 Substation Normal Operation = 7-23-10 @4:44pmVolt / Var Control Operating = 7-24-10 @4:44pm
Demand and Energy Reduction Results • VVO technology works as-expected • Testing demonstrates ~2-4% energy and demand reduction is achievable.
“Value” of VVO Compared to Generation Alternatives “LEVELIZED COST OF ENERGY ANALYSIS “– VERSION 3.0 Lazard, February 2009 Levelized cost of VVO is in the low part of the Energy Efficiency range due to low initial capital cost and no on-going fuel cost
VVO for Energy Efficiency / Capacity Reduction Energy Efficiency (24/7 Operation) Help meet state Energy Efficiency targets Receive incentives / participate in DR markets TRCs 2 to 3 – better than many current programs Reduce Energy Consumption by Customers Not limited by “participation rates” Reduce Emissions Relieve Transmission Congestion Capacity (Demand Reduction Only ) Reduce amount of capacity required at peak / critical times Short payback period if generation charges are based on peak demand Defer investment in capacity replacement or upgrades Engage in DR Market Relieve Transmission Congestion
Questions? Tom Weaver – tfweaver@aep.com