Download
1 / 19
190 likes | 323 Views
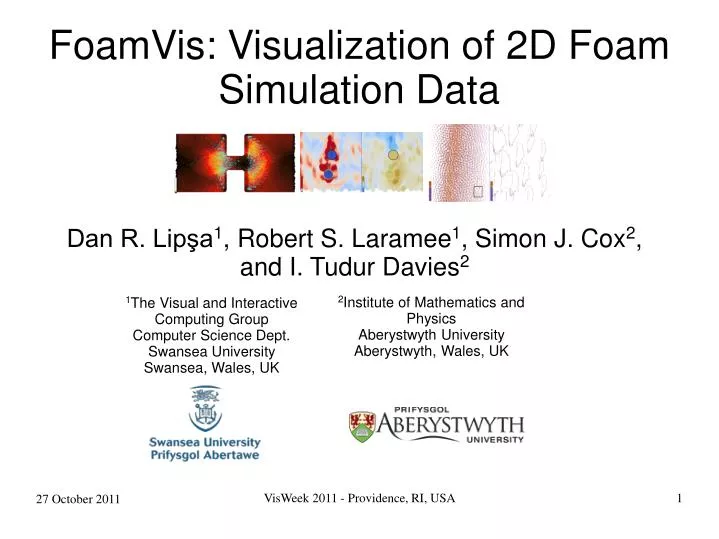
Dan R. Lipşa 1 , Robert S. Laramee 1 , Simon J. Cox 2 , and I. Tudur Davies 2. 2 Institute of Mathematics and Physics Aberystwyth University Aberystwyth, Wales, UK. 1 The Visual and Interactive Computing Group Computer Science Dept. Swansea University Swansea, Wales, UK.

E N D
Dan R. Lipşa1, Robert S. Laramee1, Simon J. Cox2, and I. Tudur Davies2 2Institute of Mathematics and Physics Aberystwyth University Aberystwyth, Wales, UK 1The Visual and Interactive Computing Group Computer Science Dept. Swansea University Swansea, Wales, UK FoamVis: Visualization of 2D Foam Simulation Data VisWeek 2011 - Providence, RI, USA 27 October 2011
FoamVis: Visualization of 2D Foam Simulation Data Overview • Motivation and Introduction to Foam Research • FoamVis Features • Results • Summary and Conclusions Visualization of bubble paths color-mapped to elongation.
FoamVis: Visualization of 2D Foam Simulation Data Motivation: Why Study Foam? • Displaces oil from porous media • Mineral flotation and separation
FoamVis: Visualization of 2D Foam Simulation Data Foam • Two-phase material: liquid and gas • Complex behavior: • Elastic solid at low stress • Plastic solid as stress increases • Liquid at high stress
FoamVis: Visualization of 2D Foam Simulation Data Foam Research Main Challenge • Foam behavior - Herschel Bulkley: Plastic solid Liquid Foam properties: - bubble size - bubble distribution - liquid fraction - surface tension ? Possible solution: Simulate foam at bubble scale (Surface Evolver)
FoamVis: Visualization of 2D Foam Simulation Data Sedimenting discs 1500 bubbles 252 time steps Foam Simulations • Constriction • 704 bubbles • 1000 time steps
FoamVis: Visualization of 2D Foam Simulation Data Topological Change • Bubbles in a 2D foam at equilibrium are 3-way connected at 120º angles. • As foam is sheared, the topology of the soap film changes. Topological change Bubbles color-mapped by velocity magnitude. Constriction simulation.
FoamVis: Visualization of 2D Foam Simulation Data Motivation: Bubble Scale Simulation Research Challenges • Triggers to various foam behaviors are difficult to infer. • Multiple attributes • Difficult to visualize general foam behavior. • Time-dependent • Large fluctuations in attribute values caused by changes in the topology of the film network.
FoamVis: Visualization of 2D Foam Simulation Data Constriction simulation, Average velocity over all time steps Motivation: Standard Methods for Foam Visualization Drawbacks • Require intervention in the simulation code for summarizing and saving the relevant data. • No ability to explore and analyze data through navigation, selection and encoding. • Slow, coarse level of detail.
FoamVis: Visualization of 2D Foam Simulation Data FoamVis Features • Works with any Surface Evolver (SE) simulation: parse and process directly SE files • Color mapping of bubble attributes: velocity, pressure, area, deformation • Overlays • Topological changes • Forces Constriction simulation, Average velocity over all time steps
FoamVis: Visualization of 2D Foam Simulation Data Where do most bubbles with negative velocity along X occur? Count + Topological changes overlay. FoamVis Features • Bubble selection/filtering: by bubble ID, location, and attribute value (using a histogram) • Image based statistical computation (average, count) • For all time steps or for a time window behind the current time step. • Around a moving body • Bubble paths • Multiple linked views • Focus&Context • Bubble and view
FoamVis: Visualization of 2D Foam Simulation Data Results: Pattern of Bubble Centers Traversing Loops Sedimenting discs simulation. Pattern of bubbles traversing loops. Orange: descent, Purple: ascent
FoamVis: Visualization of 2D Foam Simulation Data Results: Why Do Bubbles Traverse Loops? Why do bubbles traverse loops?
FoamVis: Visualization of 2D Foam Simulation Data Results: Why does one disc descend quicker than the other? Sedimenting discs simulation (t=0). Elongation: blue-red palette, Pressure: blue-tan palette. Network force: black, Pressure force: yellow Resultant force: green. The network force - contacting soap films pull normal to the circumference with the force of surface tension. The pressure force - adjacent bubbles push against the disc with their pressure force.
FoamVis: Visualization of 2D Foam Simulation Data Results: Why do discs drift laterally as they sediment? Sedimenting-discs simulation (t=43). Elongation - blue-red palette, Pressure - blue-tan palette. Sliding time window average over 10 iterations. Network force: black, Pressure force: yellow Resultant force: green.
FoamVis: Visualization of 2D Foam Simulation Data Summary and Conclusions • Foam research application area. • FoamVis - exploration, visualization and analysis of foam simulation data. • Validate hypothesis, make new discoveries and gain insight into foam behavior.
FoamVis: Visualization of 2D Foam Simulation Data Acknowledgments • We thank Ken Brakke, Susquehanna University, PA, for answering our many questions about the Surface Evolver. • This research was supported in part by: • EPSRC/P&G grant EP/F000049/1, EPSRC grant EP/D071127/1 • Research Institute of Visual Computing (rivic.org) Wales • Thank you for your attention! Any questions?
FoamVis: Visualization of 2D Foam Simulation Data Image by E. Janiaud Why 2D foam simulations? • Shorter simulation time. • Available 2D experimental data. • Experimental data easier to segment.
FoamVis: Visualization of 2D Foam Simulation Data Output Input Soap film with fixed (square wire frame) and free boundaries (surface of the table) Surface Evolver • Foam simulation program - Ken Brakke, Mathematics Department, Susquehanna University, PA • Study of surfaces shaped by surface tension and other energies, and subject to various constraints