Download
1 / 55
550 likes | 658 Views
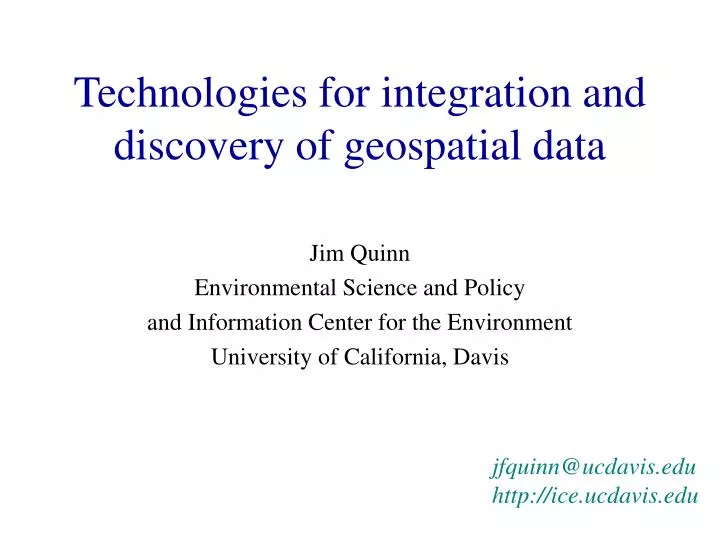
Technologies for integration and discovery of geospatial data. Jim Quinn Environmental Science and Policy and Information Center for the Environment University of California, Davis. jfquinn@ucdavis.edu http://ice.ucdavis.edu. NBII Programs. Gap Analysis (GAP)

E N D
Technologies for integration and discovery of geospatial data Jim Quinn Environmental Science and Policy and Information Center for the Environment University of California, Davis jfquinn@ucdavis.edu http://ice.ucdavis.edu
NBII Programs • Gap Analysis (GAP) • Vegetation, vertebrate distributions, protected lands • Long term population monitoring • ex: Breed Bird Surveys, Christmas counts • Integrated Taxonomic Information System (ITIS) • International programs • IABIN, NABIN, GBIF • Invasive Species Council
Regional Nodes California Pacific Basin (Hawaii) Northern Rockies Pacific Northwest Tennessee Texas Thematic Nodes Avian Fisheries Infrastructure (Administration) Proposed Southwest Invasive Species Taxonomic Services NBII Nodes
Node Vision & Objectives • Principles for environmental informatics based on distributed nodes: • Environmental information generally should be managed at its source • Core data (“Darwin Core”) should be transparently shared, idiosyncratic data should be discoverable • Provide value-added to other efforts
Multinational: MAB IABIN GISP Mexico: CONABIO, UNAM Brazil: Base de Dados Tropical Venezuela: Universidad Central de Venezuela Russia Komarov Botanical Institute United States: USGS International Programs USGS Nonindigenous Aquatic Species Program Smithsonian Environmental Research Center Hawaiian Ecosystems at Risk Project NHM & Biodiversity Research Center, University of Kansas California: California Biodiversity Council California Exotic Plant Pest Council California Food & Agriculture California Department of Transportation Friends and Colleagues
California Biodiversity Council • Founded in 1992 • Heads of State and Federal Natural Resource Agencies • 39 Signatories • Science Coordinating Committee
Regional and StatewidePolicy Drivers • Land Acquisition and Habitat Planning • Fire Protection • Clean Water Act • Sect. 303(d) and TMDLs • Endangered Species Act • Invasive species • Supporting Stakeholder Negotiations
CCRISP Methodology to Identify State Conservation Priorities • High priority biodiversity lands, freshwater aquatic ecosystems and wetlands • Prime agricultural lands • Rangelands • Forest lands • Natural lands that can sustain outdoor recreational and educational facilities and pursuits and can accommodate visitors in a natural setting • Sites with significant natural cultural values (archaeological and paleontological resources) • Critical watershed values • Urban open space with significant natural values or potential for significant restoration of natural values
Goal: Integration through tools for land use managers
Example -- Environmental effects of urban growth in Greater Sacramento How should planners identify open space to minimize biological effects of urbanization, suburbanization and exurbanization?
Growth in Greater Sacramento -- Preserving Agricultural Values HePlan -- Johnston et al, 2000
Growth in Greater Sacramento -- Rare Habitats Johnston et al., 2000
Growth in Greater Sacramento Habitat for Rare Species Johnston et al., 2000
Growth in Greater Sacramento Estimated Species Protection Johnston et al., 2000
Policy Issues • Mix of scales • Incomplete or non-digital information • Incompatible classifications and attributes
Status of critical datasets • Vegetation • GAP is only statewide coverage -- 1km2 MMU • At least 7 classifications in wide use • $35M for consensus map from imagery? • Wetlands • About 2/3 of state available as digital coverage • Variable MMUs and classifications
Status of critical datasets - 2 • Riparian • No statewide map • At least 30 agencies and organizations hold geolocated data • Rare species • High quality records • ~ 50,000 records for ~1000 species in Heritage Database (NDDB) -- backlog of several years • Records sparse from conservation lands
Status of critical datasets - 3 • Management and Ownership • Statewide coverage for public ownership • little information on private lands • dated • No wide-area coverages for • conservation easements • habitat conservation and species recovery plans • privately protected lands • Conservation projects only as a point coverage
Example:Non-Point Source Pollution • Clean Water Act 303(d) and TMDL • Tied to basins and waterways • 1:100,000 USGS base map
Data are tied to waterbodies and watersheds Calwater Hydrological subareas and State Water Board Waterbodies
Clean Water ActWaterbody Assessments Over 300,000 river miles in California -- less than 20,000 assessed
Beneficial uses and causes of impairment chosen from elements in basin plan
ExampleDrinking Water Source ProtectionSafe Drinking Water Act • 17, 000 wells, 1200 surface intakes, 10% GPSed • Crude hydrogeology of wells • Catalog of potential contaminating activities in “protection area” from predefined list • industrial solvents and dry cleaners • mines (3000 of 30,000 mapped) • leaking underground storage tanks • agricultural pesticide use
Local Planning -- Geospatial Framework Required for CEQA Compliance • 103 Required Elements for California Environmental Quality Act (Environmental Impact Reports) • Some framework geospatial data required for each • No framework dataset is complete and standardized among all California counties Source: Robert Ball California Geographic Information Association
“Quasi-spatial” data drives public policy Environmental data is (almost) always tied to geolocators, but primary occurrences are frequently point data with complex non-spatial attributes
Strategy • Highly distributed information system supporting locally unique data • Network of “nodes” • Multiple points of access or portals • Interoperability using shared vocabularies • Migration toward XML and W3C standards
Tools for Creating a Standard Data Reporting Structure • XML: Extensible Markup Language • Emerging as a standard way to exchange structured data • RDF: Resource Description Framework • Good for developing the semantics of a network • Other technologies: Z39.50, LDAP
Bioregions Counties Cities Watersheds Waterbodies Public land polygons (e.g., National Parks and Forests) Place names Road and milepost California geographic thesaurus elements
Research Issues • Integrating spatial environmental data with process models • Monitoring strategies -- taking advantage of remote sensing and automated change detection • Making polygons from (non-representative) point data
Hyperspectral Data Incorporate 4m AVIRIS Hyperspectral Data into Watershed Model Classification of Riparian Vegetation, Stream Parameters, & Land Use Additional Field Work to Validate Model
Riparian-Topographic Shading Model Vegetation Distribution Converted to Height by DBH Class & Percent Hardwood / Conifer Hourly Solar Incidence for Critical Date: July 22 Riparian Corridor Delineation 200 meter radius from streams 1996 Aerial Photographs Reach Averaged Values attributed to linear hydrographic network for Current Conditions & Potential Conditions Digital Elevation Model 10 meter resolution
RipTopo Model Results Current Shading Conditions Potential Shading Conditions
Integrating spatial environmental data with process models -- Bay-Delta fish models • Biological monitoring data is weekly/biweekly, but spatially precise • Transport models have hour time-scales, but km spatial resolution • Economic models are compartment models