Download
1 / 1
10 likes | 98 Views
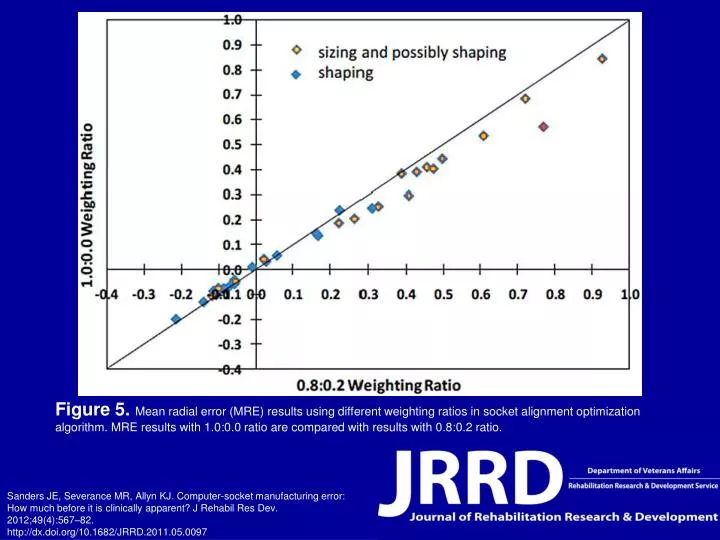
Figure 5. Mean radial error (MRE) results using different weighting ratios in socket alignment optimization algorithm. MRE results with 1.0:0.0 ratio are compared with results with 0.8:0.2 ratio.

E N D
Figure 5. Mean radial error (MRE) results using different weighting ratios in socket alignment optimization algorithm. MRE results with 1.0:0.0 ratio are compared with results with 0.8:0.2 ratio. Sanders JE, Severance MR, Allyn KJ. Computer-socket manufacturing error: How much before it is clinically apparent? J Rehabil Res Dev. 2012;49(4):567–82.http://dx.doi.org/10.1682/JRRD.2011.05.0097