Download
1 / 14
140 likes | 233 Views
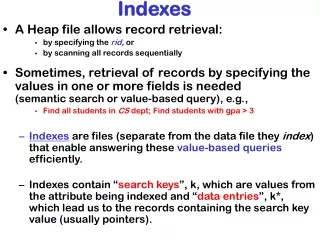
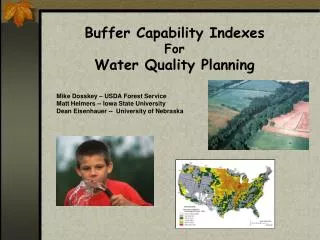
Explore better buffer locations using sediment trapping efficiency data and interactions for effective water quality planning. Utilize Buffer Capability Index (BCI) maps for Missouri and the Eastern U.S. to assess sediment, groundwater, and dissolved pollutants.

E N D
Buffer Capability Indexes For Water Quality Planning Mike Dosskey – USDA Forest Service Matt Helmers -- Iowa State University Dean Eisenhauer -- University of Nebraska
Missouri 1mi 0 Better Locations for Buffers?
Missouri 1mi 0 Soil Survey
Missouri 1mi 0 Sediment Trapping Efficiency STE (%) 10-25 25-50 50-75 75-100 Not Farmable Water
Sediment Trapping Efficiency (%) STE = 100 – 85 e -1320 (SF) Sediment Factor = D50 / R K L S (104) Validation & Calibration Sediment
Sediment STE = 100 – 85e -1320 (SF) Sediment Factor = D50 / R K L S (104) Dissolved Groundwater 1. Interaction – Hydric + Shallow WT 2. Interaction – Hydric + Deep WT 3. Interaction – Not Hydric + Shallow WT 4. No Interaction – Not Hydric + Deep WT WTE = 97 (IF) 0.26 Infiltration Factor = Ksat2 / R L S Three Functions
BCI Maps: Cameron-Grindstone Watershed, MO Photo Sediment Dissolved Groundwater
BCI Maps: Upper Potomac Watershed, PA Sediment Dissolved Groundwater
Chesapeake Bay Watershed Land Cover Sediment Groundwater Dissolved
Sediment Eastern U.S. Farmlands Groundwater Dissolved
Eastern U.S. Farmlands: Groundwater Percent Area 75-100 50-75 20-50 0-25 Not Farmable Water
Eastern U.S. Farmlands: Sediment STE 10-25 25-50 50-75 75-100 Not Farmable Water