Download
1 / 39
390 likes | 495 Views
HUMAN BIRTH WEIGHT Variation in birth weight Sources of variation in birth weight Implications of variation in birth weight. Normal Rate of Fetal Growth. 15 weeks = 5 grams/day 20 weeks = 10 grams/day 30 weeks = 25 grams/day 35 weeks = 35 grams/day

E N D
HUMAN BIRTH WEIGHT Variation in birth weight Sources of variation in birth weight Implications of variation in birth weight
Normal Rate of Fetal Growth • 15 weeks = 5 grams/day • 20 weeks = 10 grams/day • 30 weeks = 25 grams/day • 35 weeks = 35 grams/day • 40 weeks = 15 grams/day • May vary by race, gender, multiple gestation
Means: Males: 3625 gms 7lbs 10oz Females: 3472 gms 7lbs 6oz
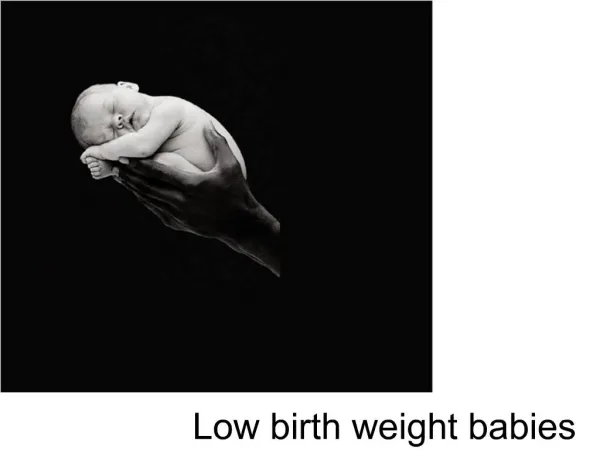
Categorizing birth weight Before 1960s: 1. Low Birth Weight or LBW defined as less than 2500 gms =Prematurity All other babies 2500 gms and over Focus was on low birth weight babies because of their increased mortality
Low Birth Weight • Low Birthweight • <2500 grams • Often due to prematurity • Very Low Birthweight • <1500 grams • Almost always a prematurity component • Differences in outcome if LBW due to: • Prematurity • Term but SGA • Preterm plus SGA
Problems with this classification: Not all small babies are premature Not all premature babies are small World Health Organization 1961 promoted use of “preterm” rather than “premature” Gestation: time from fertilization to delivery normally 38 weeks (266 days).
▪Large for gestational age: Weight is above the 90th percentile at gestational age (LGA) > 8lbs 3oz (4000gm) ▪Appropriate for gestational age: Normal birth weight (AGA) ▪Small for gestational age: Weight is below the 10th percentile at gestational age (SGA) < 5lbs 7oz ( 2600gm)
High Birth Weight • Incidence: until the new WHO sponsored standard neonatal growth charts become available in 2014, estimated frequencies indicate that HBW represents anywhere from 3,5% to 10% of all births. • This large variation is probably due to changing definitions applied to different populations.
HUMAN BIRTH WEIGHT Variation in birth weight Sources of variation in birth weight Implications of variation in birth weight
High Birth Weight • Large babies can be born under two different circumstances: • Healthy mothers, who are themselves constitutionally large, often married to large fathers.
High Birth Weight • Mothers who have either metabolic or genetic problems: most common are the disorders related to carbohydrate intolerance during pregnancy: • insulin-dependent diabetes; • gestational diabetes, • metabolic syndrome; • maternal obesity.
High Birth Weight Influence of Maternal WeightGainduringPregnancy
Increase in birth weight with increased parity
Plurality (Multiple births) Singleton birth weight 7lbs 6oz (3356gm) Twin birth weight 5lbs 10oz (2585gm) Triplet birth weight 4lbs 4oz (1911gm) (LBW 5lb 8oz (2494gm))
Dizygotic twins with two amnions, two chorions or Monozygotic twins with Two amnions, two chorions Monozygotic twins with One amnion, one chorion Monozygotic twins with Two amnions, one chorion Higher > Lower
Sex of the twins Same sex: Higher concordance in birth weight Opposite sex: Higher discordance in birth weight
DZ twins MM MF Female twins larger on average than FF twins FF
Sex of the twins Same sex: Higher concordance in birth weight Opposite sex: Higher discordance in birth weight Higher prenatal mortality
Whites 3549 African American 3330 Hispanic 3452 Native American 3523 Heritability of birth weight 74% Adjusted for sex and term
Effect of environment: First generation of immigrants Asian immigrant study Born in Asia: 2946g First generation UK: 3196g
Gestational diabetes (GDM) in the mother increases The risk of a high birth weight baby (LGA) 2. The risk of GDM in subsequent pregnancies
Factors that can influence birth weight: Altitude Sex Parity Multiple or single birth Genetics Maternal health (GDM) Maternal nutrition (excessive or insufficient weight gain)
Nutritional Etiologies • Malnutrition must be severe to have a dramatic effect • Leningrad: prolonged malnutrition: • BW reduced 400-600 grams • Holland: 6 months of famine • BW reduced 10% if famine during 3rd trimester • Depends on preceding nutritional status and timing of malnutrition
HUMAN BIRTH WEIGHT Variation in birth weight Sources of variation in birth weight Implications of variation in birth weight
Epidemiological studies revealed that full-term babies with low birth weight had higher mortality than full term-babies of normal weight. New terminology: Small for Gestational Age (SGA) (small babies who are not preterm, just below the 10 percentile for GA) Intrauterine Growth Retardation (IUGR)
IUGR Mortality • Perinatal mortality inversely proportional to percentile • 0-5x relative risk if between 2.5th-10th % • 8-10x relative risk if <2.5th % • Fetal mortality is 50% higher than neonatal • Males higher than females • Growth versus Gestational Age
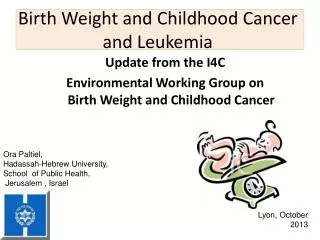
High Birth Weight • A potential risk associated to high birth weight is the higher chances to develop leukemia. Drs. Robert Caughey and Karin Michels form Harvard published in the International Journal of Cancer (2009) their results: an overall risk of developing leukemia 35 times higher for higher birth weight babies than for those of normal birth weight.
High Birth Weight Fifteen-year expected adult weight trajectories by birth weight group in Michigan Bone Health and Metabolism Study women. Normal, low, and high birth weight was defined as 2,500–4,000 g, <2,500 g, and >4,000 g, respectively. Fifteen-year trajectories were adjusted for participant's age at baseline and were similar in all other body composition measures, except waist-to-hip ratio. Eileen Rillamas-Sun, MaryFran R. Sowers, Siobán D. Harlow and John F. Randolph Jr. Obesity 20, 463-465 (February 2012)
High Birth Weight Conclusions: Babiesbornwith HBW represent a smallergroupthanthosebornwithlowbirthweight. They are, nonetheless , animportantpublichealthissuebecause: 1-They haveimmediateproblems at birth. 2-They are nowthefocus of largerepidemiologicalinvestigations, becauselongtermeffects of neonatal macrosomia do notfade; rather, theypersistthroughlifetimeincreasingtherisk of developingobesity, metabolicsyndrome, diabetes mellitus and hypertensivedisorders.
OTHER SPECIES: • Dairy Cattle • Meta-analysis of research projects from across country: • Birth weight was most consistently important trait • for explaining variability in milk production • Heifers weighing between 30-40 kg (66-88 lbs) • produced most milk as cows