Download
1 / 13
130 likes | 160 Views
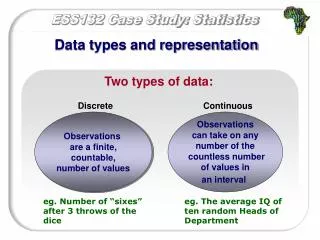
Discrete. Continuous. Observations are a finite, countable, number of values. Observations can take on any number of the countless number of values in an interval. Data types and representation. Two types of data:. eg. Number of “sixes” after 3 throws of the dice.

E N D
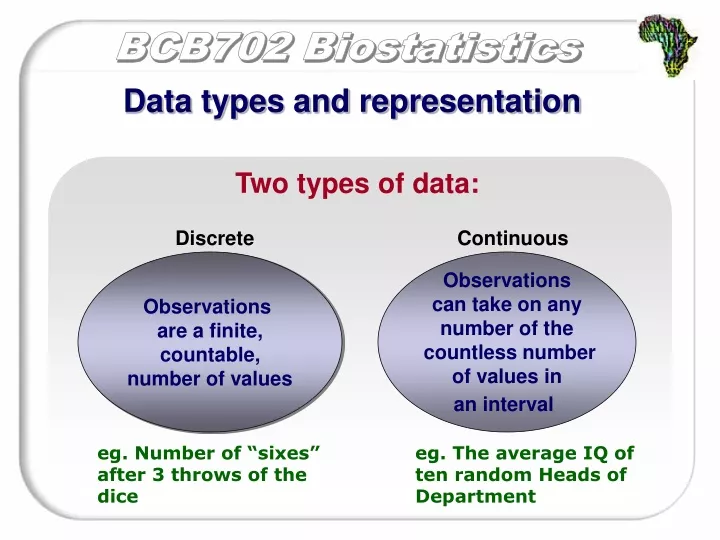
Discrete Continuous Observations are a finite, countable, number of values Observations can take on any number of the countless number of values in an interval Data types and representation Two types of data: eg. Number of “sixes” after 3 throws of the dice eg. The average IQ of ten random Heads of Department
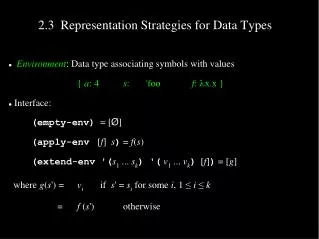
Data types and representation Types of measurements Nominal Objects are named and assigned to classes eg. male or female Ordinal Objects are either greater, or smaller than, a comparative object eg. finishing positions in a race Ratio level Basic standard interval exists + meaningful zero eg. mass Interval level Basic standard interval is introduced, but no true zero eg.temperature in celsius
Data types and representation Summarising discrete data:
Summarising discrete data: Frequency tables Frequency Eye Colour 33 14 3 Brown Blue Green Data types and representation
Frequency tables Relative Frequency Frequency Eye Colour Brown Blue Green 33 14 3 66% 28% 6% Data types and representation Summarising discrete data:
Data types and representation Summarising discrete data: Frequency bar graph
Summarising discrete data: Relative frequency bar graph Data types and representation
Data types and representation Summarising continuous data:
Summarising continuous data: Frequency Hours of Sleep 1 3 6 14 16 5 3 2 3 - 4 hrs 4 - 5 hrs 5 - 6 hrs 6 - 7 hrs 7 - 8 hrs 8 - 9 hrs 9 - 10 hrs 10 - 11 hrs Frequency tables Data types and representation
Data types and representation Summarising continuous data: Frequency bar graph (Histogram)
Data types and representation Summarising continuous data: Relative frequency bar chart
Summarising continuous data: Line graph Data types and representation
Summarising continuous data: Scatter graph Data types and representation