Download
1 / 71
810 likes | 1.26k Views
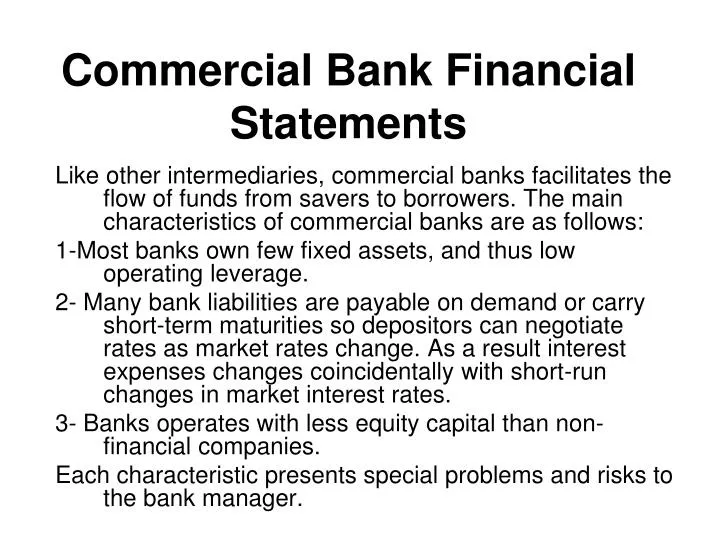
Commercial Bank Financial Statements. Like other intermediaries, commercial banks facilitates the flow of funds from savers to borrowers. The main characteristics of commercial banks are as follows: 1-Most banks own few fixed assets, and thus low operating leverage.

E N D
Commercial Bank Financial Statements Like other intermediaries, commercial banks facilitates the flow of funds from savers to borrowers. The main characteristics of commercial banks are as follows: 1-Most banks own few fixed assets, and thus low operating leverage. 2- Many bank liabilities are payable on demand or carry short-term maturities so depositors can negotiate rates as market rates change. As a result interest expenses changes coincidentally with short-run changes in market interest rates. 3- Banks operates with less equity capital than non-financial companies. Each characteristic presents special problems and risks to the bank manager.
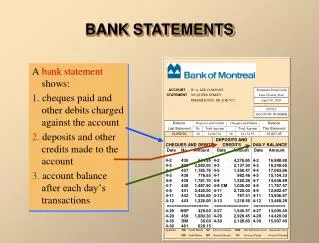
The Balance Sheet It present financial information comparing what a bank owns with what it owes and the ownership interest of stockholders. Assets indicates what the bank owns Liabilities represent what the bank owes. Equity refers to the owners’ interest. Assets = Liabilities + Equity
Bank Assets It falls into one of four general categories as follows: Loans, which are the major asset in most banks’ portfolios and generate the greatest amount of income before expenses and taxes. Loans may be group into several categories, such as: Real estate loans. They are secured by real estate and generally consist either of (1) property loans or (2) interim construction loans. Commercial Loans which consist of commercial and industrial loans, loan to financial institutions, and obligations(other than securities) to state and political subdivisions. Individual Loans include those negotiated directly with individuals for household, family and other personal expenditures.
Bank Assets-con. • Agricultural Loans which are directed to finance agricultural production and other loans of farmers. • Loans in Domestic Offices include all other loans and all lease-financing receivables in domestic offices. • Loan and Lease in Foreign offices, are essentially business loans and lease receivables made to foreign companies or loans guaranted by foreign governments. • Net loans and leases can be calculated as follows:
Bank Assets-con. Net Loans and Leases = Gross Loans and Leases – Unearned Income – Loan and Lease Loss Allowances.
2. Investment Securities. They are held to earn interest, help to meet liquidity needs, speculate on interest rate movement, and serve as part of bank’s dealer functions. Investment securities may be group into several categories, such as:
Treasury and Agency Securities. • Municipal Securities • Foreign Debt Securities. • Other Securities. • Interest-Bearing Bank Balances. • Total Earning Assets = Net Loan and Leases + Total Investment • Other items included in the assets account are Non-interest Cash and Due from Banks. They consist of:
Vault Cash: it is coin and currency that the bank holds to meet customers withdrawals. • Deposit held at Federal Reserve Banks: They are demand balances used to meet legal reserve requirements, assist in check clearing and wire transfers, or effect the purchase and sale of Treasury Securities. • Deposit held at other Financial Institutions, called correspondent banks, primary to purchase services. • Items in the process of collection. • Other assets are residual assets of relatively small magnitude, including customers’ liabilities to the bank under acceptance, the depreciated value of bank premises and equipment, other real estate owned (OREO)., etc.
Bank Liabilities and Stock Holders’ Equity Bank funding sources are classified according to the type of debt instrument and equity component. They consist of the following: • Demand Deposit, they are transaction accounts held by individuals, partnerships, corporations, and government that pay no interest.
Bank Liabilities and Stock Holders’ Equity.cont. • Negotiable Order of Withdrawal (NOW), Automatic Transfer From Savings (ATS) accounts, and Money Markets Deposits Accounts (MMDAs), represent interest-bearing transactions accounts. NOW and ATS accounts pay interest set by each bank without federal restrictions. NOW are available only to non-commercial customers.
Bank Liabilities and Stock Holders’ Equity.cont. • Saving and Time Deposits: They have in the past, represented the bulk of interest-bearing liabilities at banks. Now a days MMDAs and time deposit under some certain amount of money have become the largest source of interest-bearing liabilities.
Bank Liabilities and Stock Holders’ Equity. cont. Deposits Held in Foreign Offices: They refer to the same types of dollar-denominated demand and time deposits discussed above except that the balances are issued by a bank subsidiary (owned by the bank holding company) located outside the country.
Bank Liabilities and Stock Holders’ Equity .cont. Subordinated Notes and Debentures: they consist of notes and bonds with maturities in excess of one year. Most meet requirement as bank capital for regulatory purposes. When bank fails, depositors are paid before subordinated debt holders.
Bank Liabilities and Stock Holders’ Equity. cont. All Common and Preferred Capital or Stock Holders’ equity: It is the ownership interest in the bank. • Common an d preferred stock are listed at their par values while the surplus account represents the amount of proceeds received by the bank in excess of par when it issued the stock. • Bank Cumulative Net Income = Retained Earnings since the Firm Started Operation – All Cash Dividends Paid to Stock Holders. • Other equity is small and usually reflects capital reserves.
Income Statement A Bank’s Income statement reflects the financial nature of banking, as interest on loan and investments comprises the bulk of revenue. • Income Statement Format starts with interest income, and end with the net income, which is divided between dividends and retained earnings.
Income Statement. CON. • Net Income is calculated as follows: • NI = NII – Burden – PL - + SG – T NII = Net Interest Income before provisions. Burden = Represents Bank burden (non-interest expense > non-interest Income). PL = Provision for Loan Losses. SG = Securities Gains (losses). T= Taxes including accounting adjustments and extraordinary items.
Income Statement. CON. NI can be calculated as follows: NII= II – IE II = Total Interest Income. IE = Total interest expense. Burden = OE – OI OE = Noninterest Expense or overhead expense. OI = Noninterest Income.
Income Statement. CON. Bank Efficiency Ratio (Eff) is calculated as follows: Eff = OE/(NII + OI). The contribution of each of the components is summarized bellow: NII 2,425.141 -Burden -972,382 -PLL -65,000 + SG 40817 - T 527,690 --------------------------- = NI $900,886
Income Statement. CON. Eff = 2343936/(2425141+1371554)= 0.617 This ratio is widely used in the practice. It measure the banks’ ability to control non interest expense relative to net operating income (NII – non interest income). It indicate how much a bank pays in no-interest expense for one dollar of operating income. Bank analyst expect to keep this ratio below 55% per dollar of operating income.
The relationship between the Balance Sheet and the Income Statement -Both sheets are correlated. The net income is determined by the composition of assets and liabilities and the relationship different interest rates. -The Mix of deposits between consumer commercial consumers affects the services provided by and thus the magnitude of noninterest income and noninterest expense.
The relationship between the Balance Sheet and the Income Statement The ownership of nonbank subsidiaries increases fee income but often raises noninterest expense. The following analysis emphasizes the above interrelationships. As it is known: Assets = liabilities + equity This equation can be restated as:
The relationship between the Balance Sheet and the Income Statement A = L + NW Where, While net interest income can be represented as:
The relationship between the Balance Sheet and the Income Statement Where: Ai = dollar magnitude of the ith asset Lj = dollar magnitude of the jth liabilities. NM = dollar magnitude of the stockholders’ equity. ri = average pretax yield on the ith asset Cj = average interest cost of the jth liabilities
The relationship between the Balance Sheet and the Income Statement Interest Earned on asset = Interest Paid on each liability = -The new statement of NII indicates what factors can cause net interest income to change over time. These factors are: 1- Changes in the composition or volume of assets and liabilities. As portfolio composition change, the respective A’s and L’s change in magnitude.
The relationship between the Balance Sheet and the Income Statement This alters net interest income because A or L is multiplied by different interest rates. 2- A change in average asset yields and interest costs may rise or fall due to changing in interest rates and lengthening or shortening of maturities on underlying instruments.
The relationship between the Balance Sheet and the Income Statement We distinguish between two type of banks: 1- Retail Banks which focus on individual consumers banking relationships. Therefore, individual demand, saving, and time deposits comprise most of liabilities while consumers and small businesses loans linked to key individuals are a higher fraction of the loan portfolio.
The relationship between the Balance Sheet and the Income Statement 2- Wholesale Banks deal primarily with commercial consumers so that they typically operate with fewer consumers deposits, more purchased liabilities, and hold proportionately more business loans to large firms. This difference in portfolio composition produces different yields on earning assets (ri) and costs of liabilities (cj).
The relationship between the Balance Sheet and the Income Statement Again we refer to NI equation: NI = – Burden – PL - + SG – T Net income in excess of dividends payments to shareholders increase retained earnings and thus total equity.
The Return on Equity Model The return on equity model is adopted her to analyze bank profitability and identifies specific measures of credit risk, interest rate risk, operation risk, and capital risk. This means the adoption of ratio analysis, the Dupont system of financial analysis.
The Return on Equity Model-Con. The Uniform Bank Performance Report. The UBPR is a comprehensive analytical tool adopted for supervisory purposes. The UBPR contains a wealth of profitability and risk information. Profitability Analysis Aggregate bank profitability is generally measured and compared in terms of Return on Equity (ROE) and Return on Assets (ROA). The ROE model relates ROE to ROA and financial leverage, and then composes ROA into its contributing elements.
The Return on Equity Model-Con. By definition: ROE = Net Income/Total Equity -It measures the percentage return on each dollar of stockholder’ equity. - The higher the return the better, as banks can add more to retained earnings and pay more in cash dividends when profits are higher.
The Return on Equity Model-Con. ROE cab rewritten as follows: Where EM is the equity multiplier. EM measures financial leverage and represents both profit and risk measure.
The Return on Equity Model-Con. Example of two banks A and B ME of Bank A = 100/10 = 10x ME of Bank B = 100/5 =20x
The Return on Equity Model-Con. In the above example if both banks earned 1% on assets, Bank A would report a ROE of 10% while the ROE of Bank B would equal 20%. This means Bank B provide shareholders a return that is twice that of Bank A. If each bank reported a negative of 1% of ROA, the ROE of Bank B would equal (–20%) or twice a loss of Bank A.
The Return on Equity Model-Con. EM represents a risk measure because it reflects how many assets can go into default before a bank become s insolvent. Consider the ratio of total equity to total assets or 1/EM, the ratio for bank A equals 10% while the ratio for bank B is 5%. Both hold the identical assets, but bank A is less risky Bank than B.
The Return on Equity Model-Con. Expense Ratio and Asset utilization The UBPR provides a wealth of data to assist in the analysis of a bank’ performance. The ROA is composed of two principle parts: • Income generation • Expense control (including taxes) Recall that net income NI is: NI = Total Return (TR) – Total Operating Expenses (TXP) – Taxes Dividing both sides of the above equation by the average total assets (TA) will get:
The Return on Equity Model-Con. Where: AU = Assets Utilization ER = Expense Ratio Tax = Tax Ratio Expense Decomposition: ER Components. It provides intuitive interpretation. For example if ER = 5%, it means that bank’ gross operating expenses equal 5% of total asset. The lower ER the more efficient a bank will be in controlling expenses and vise versa.
The Return on Equity Model-Con. There are three isolated types of specific ratios of operating expenses: Interest expense ratio = Noninterest Expense Ratio = Provision for loan Loss Ratio =
The Return on Equity Model-Con. The sum of these three ratios equals ER: ER = The ER can be calculated directly from UBPR report or to sum all the three ratios. The fist way is: ER = (Total interest expense + Total Non-interest Expense + Provision for Loan & lease Losses)/Average Total Assets.
The Return on Equity Model-Con. The second way is to sum all three ratios to get the ER. All other factor being equal, the lower each ratio, the more profitable the bank. -Interest expense and noninterest expenses required to be examined by source. -Interest expense may vary between banks for three reasons: 1-rate effects 2- Composition effects. 3- Volume effects.
The Return on Equity Model-Con. Noninterest expense can decomposed into: • Personnel expense (salaries and benefit payments) • Occupancy expense. • Other operating expenses. Income Decomposition: Asset Utilization Components (AU). The greater is AU, the greater the bank’s ability to generate income from the assets that the own. When a bank’s AU is 10%, means its gross return on total assets equal 10%. A higher figure indicates higher profit. If a bank ER is 7%, then bank net return on investment (assets) before tax is 3%.
The Return on Equity Model-Con. Total revenue TR can be divided into three components: TR = Interest Income (II) + Noninterest Income (OI) + Realized Security Gains or Losses (SG) Divide both side of the above equation by TA:
The Return on Equity Model-Con. This equation indicates the sources of income. Yield on asset can be calculated as follows: Interest income would be decomposed into its components to examine the percentage of each asset relative to total assets.
The Return on Equity Model-Con. The Bank’s Earning Base (EB) ratio is used to examine whether one bank has more or less assets earning interest than peers. EB can be calculated as follows: Earning assets include all assets that generate explicit interest income or lease receipts.
The Return on Equity Model-Con. Noninterest Income can be decomposed into its contributing sources, in order to examine the contribution of each source to assets utilization (AU). Earning Base -The bank earning base can be used to compare the proportionate investment in earning assets to total assets. -It indicates whether one bank has more or less assets earning interest than peers.
The Return on Equity Model-Con. Earning base can be calculated as follows: Earning Assets includes all assets that generate explicit interest income or lease receipt.
The Return on Equity Model-Con. Tax payment is the other factor which affect the ROA, accordingly, ROE can be calculated as follows: ROE = ROA*EM, therefore, ROE = [AU – ER – TAX]*EM Several profitability measures are used in the practice such as Net Interest Margin (NIM), Spread, Burden Ratio, and Efficiency Ratio. The can calculated as follows:
The Return on Equity Model-Con. *NIM is a summary measure of net interest return on income producing assets. *Spread is a measure of the rate spread or funding differential. It is the difference between the average yield on earning assets and the average cost of interest-bearing liabilities. *Both NIM and Spread are extremely important in evaluating a bank’s ability to manage interest rate risk. For example if interest rate increase, both interest income and interest expense will increase because some assets and liabilities will re-price at higher at higher rates.