Download
1 / 42
420 likes | 545 Views
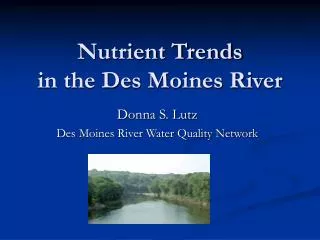
Long-term Monitoring of the Des Moines River. Donna S. Lutz Des Moines River Water Quality Network. Presented at the Des Moines Water Works January 28, 2008. What is the Des Moines River Water Quality Network?.

E N D
Long-term Monitoring of the Des Moines River Donna S. Lutz Des Moines River Water Quality Network Presented at the Des Moines Water Works January 28, 2008
What is the Des Moines River Water Quality Network? • Initiated in July 1967 as preimpoundment study for Saylorville Reservoir, expanded to Red Rock Reservoir in 1971 • Long-term record, 40 years at many sites, total of 252 parameters, about 485,000 individual data records • Currently 7 regular sampling sites, monitored 22 times per year for up to 50 parameters • Data available through annual reports, paradox • database, & project webpage
Des Moines River Basin • Length 535 mi • Width 50 mi • Basin 12,884 sq mi • about ¼ size of Iowa • Saylorville Reservoir • 24 mi valley/54 mi flood • 5,520 acres/ 16,100 flood • 1,100 ac-ft/yr sedimentation • Red Rock Reservoir • 18 mi valley/33 mi flood • 15,250 acres/ 1,625,00 fl • 4,470 ac-ft/yr sedimentation
Raccoon River Sub-basin North Raccoon/Middle Raccoon/South Raccoon Basin 3,411 sq mi
Routine Parameters • Physical • temperature, flow/elevation • turbidity, secchi disc depth, gas saturation • Chemical • dissolved oxygen, BOD, TOC, nutrients, suspended solids • metals, pesticides • Biological • chlorophyll pigments • bacteria
Important Programs: Short-term • Bacteria • River, reservoir and beaches • Is it safe to swim, wade? • State of Iowa WQ Stds • Based on E Coli • Class A1 & A3 (1o & children) • geomean 126 /100ml • Sample max 235 /100ml • Class A2 (2o contact) • geomean 630/100ml • Sample max 2,880 /100ml Bacteria Monitoring
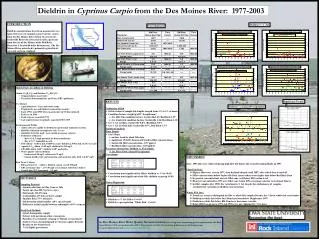
Important Programs: Short-term • Are they safe to eat? • For people and critters • Cyprinuscarpio • Fillets (28 yr) Whole (20 yr) • Dieldrin, Chlordane, Heptachlor epoxide, Alachlor, Trifluralin and Chlorpyrifos Electrofishing on Iowa River Pesticides in Fish
Important Programs: Short-term • Fish Kill Investigations • Thermal Stress • Dorosomacepedianum • Large kills, one species, similar size • Gas Supersaturation • Minor to large kills, many species and size ranges • Either extreme gas pressure or lowered outflow
Important Programs: Short-term • What’s Up? • Why is water so foamy? • Oily? • Green?
Important Programs: Long-term • What is normal? • Is water quality improving? (degrading or can’t tell?) • Major Players • Nutrients • Pesticides • Chlorophyll • Bacteria • WQI
Significant Findings • Non-point sources are the main contaminants; • soil erosion and siltation primary resource problem • Ave. loading to Red Rock 5,400 metric tons/day • Point source loading has decreased • Improved wastewater treatment has significantly reduced ammonia loading • Nitrate levels have increased, with the greatest increases seen 1967-1986, paralleling increases in N fertilizer use • Total Phosphate levels have decreased slightly, but only by about 0.01 mg/year
Significant Findings (cont’d) • Overall, water quality has significantly improved at most sites, according to water quality index values • Pesticide levels in fish are low, but may still be of concern • Gas supersaturation-induced gas bubble traumacauses periodic fish kills below Red Rock Dam
DMRWQN Website http://te-webserver.cce.iastate.edu/research/lutz/dmrwqn/dmrwqn.html • Project description, site photos • Monitoring event data, monthly & annual reports • Beach bacteria data • Long-term data available from Lutz or website • Acknowledge source, ie RI Corps • Provide us with analysis or report
Focus on Nitrite +Nitrate N • Ammonia oxidized to nitrate(bacterially mediated) • Nitrite, intermediate product, (1967-76, max 0.68 mg/l, 99% of samples <0.20 mg/l) • Sources • Fertilizers, oxidation or organic N, fixation of N2, precipitation, sewage effluents • Losses • Leaching, assimilation living organisms, conversion to other forms • Soluble, easily leaches from soil TRANSFORMS & MOVES with WATER
Regression Models Relating Baseflow to Nitrate Qb provided best r2 value (0.61) compared to Q (0.59), Qs (0.48) or Q% (0.27)
What is normal? • Des Moines River at Boone • 40 yr annual average, 5.86 mg/l • Raccoon River at Van Meter • 35 yr annual average, 7.07 mg/l → Was 2007 water year unusual? DMR 7.11 mg/l Raccoon R 9.58 mg/l
Are nitrate concentrations increasing? Need to use statistical techniques to discern and describe trends • Data is not normally distributed so used non-parametric statistics • Loftis and Ward, Colorado State University - tested 7 statistical tests Recommend Seasonal Kendall test • Data was flow-adjusted – influence of climatic events removed
Seasonal Kendall Tau Trend Analysis, Significant Trends (95%) (from Monthly Mean Data, flow-adjusted) NO2+NO3 N
Raccoon R at Van Meter, Recent data shows increasing trend 0.14 mg/l/yr *but only at 90% confidence
DMR at Boone, Recent data shows increasing trend 0.26 mg/l/yr
What this means to DMWW • Nitrate concentrations are increasing in the Raccoon River, currently at a rate of 0.15mg/l/yr • Is the 10 mg/l drinking water standard being exceeded more often? Yes, in the Des Moines River, maybe in the Raccoon River.
Overall, is water quality better? • Yes, according to WQI • DMR WQI based on • %DO (0.21) • pH (0.14) • BOD (0.14) • NO2+NO3 (0.13) • Ammonia (0.17) • Turbidity + Sus Solids (0.21)
For more information dslutz@iastate.edu http://www.ccee.iastate.edu/research/lutz/homepage.html