Download
1 / 25
250 likes | 594 Views
PSE&G Condition-Based Maintenance. Angela Rothweiler October 13, 2009 PI Seminar - Philadelphia. Agenda. Background Problem Solution Asset Registry CMMS Functional Areas Data Collection Condition Assessment & Criticality Inspection Process Example Critical Success Factors.

E N D
PSE&G Condition-Based Maintenance Angela RothweilerOctober 13, 2009PI Seminar - Philadelphia PSEG T&D CBM
Agenda • Background • Problem • Solution • Asset Registry • CMMS Functional Areas • Data Collection • Condition Assessment & Criticality • Inspection Process • Example • Critical Success Factors 2009 PI Seminar - Philadelphia PSEG T&D CBM
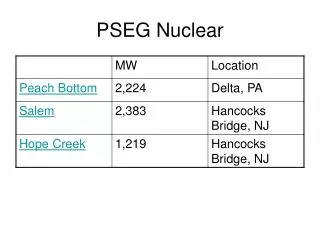
Background • Utility Overview • New Jersey Based • Total Assets ~ $14 Billion • Total Revenue ~ $7 Billion • Service Territory • 70% of New Jersey’s population • 2.0 million Electric customers • 1.6 million Gas customers • 2,600 Square Miles • Delivery Implementation • 1999 – SAP • 2000 - OMS, GIS & CAD • 2002 - CMMS PSEG T&D CBM
Problem • No predictive maintenance program or strategy • Significant liability risk and system outage potential from old equipment vulnerable to failure • Limited assessment tools for determining asset condition • Decreasing expertise in both field maintenance and engineering • No formalized capital spending program • Asset Information in a variety of disparate systems Asset Population by Division and Age Class Within Equipment PSEG T&D CBM
Inside Plant Electric Asset Registry • Equipment & Locations • Class and Characteristics • Nameplate • Maintenance Plans (56k Plans) • Calendar-based • Counter-based • Condition-based • Notifications • Damage and Cause Codes grouped by Equipment • Equipment Visibility • PM Plan Cost/Hours vs. Actual • CM Cost PSEG T&D CBM
Data Collection Raw data Analysis & Reporting Measurementpoints Feedback Maintenance Management Notification Functional Areas • Data Collection • SAP Asset Information • Time-Series Data Collection Application • Diagnostic and Inspection Data • Asset Analysis and Reporting • Condition Assessment • Work Prioritization • Alerts / Notifications • Maintenance Management • Measurement Points • Maintenance Plan Modifications • Notifications PSEG T&D CBM
Data Collection & Consolidation PI - OPC Doble Distribution SCADA Electrical test results Breaker Tests Transmission SCADA PI HDW Diagnostic data ESOC PI Transformer loads Delta-X MV90 Transformer oil analysis SAP-PM MDT Hydran PI Manual Logger SAP order history and technical object updates Weekly substation inspection Gas equipment results PSEG T&D CBM
Condition Assessment Overview • Calculation Structure • CA = F1(M1) + F2(M2) + F3(M3) + … • Factors driven by data available • Example Factors • CM Cost & Count for Past 6 Months • Operation Count for Past 6/12 Months • Gas Analysis – Change over time • Average Load over Time • Peer Groups • Apply calculations by peer group • Voltage, Class, Type • Example Groups: • 26KV – 69KV GCB • 138KV+ Power Transformer • LTC Vacuum Tanks PSEG T&D CBM
Criticality • Calculation Structure • CA = F1(M1) + F2(M2) + F3(M3) + … • SAP Static Factors • Voltage • Location • Replacement Cost • Age • Peer Groups • Apply calculations by Equipment Class • Example Groups: • Gas Circuit Breaker • Power Transformers • Use as a tie breaker in CA evaluation
Triggers Measurement Document Interface PM Orders Notifications Order & Status Updates Data Tour Tour and Values Job and Status CAD/PI Substation Inspection Process PI Manual Logger database PI Manual Logger Data entry • SAP generates inspection order • CAD Auto-dispatch orders to operators groups • Operator collects inspection data via PI-ML and sends to PI • PI evaluates data and generates SAP notifications or transfers measurement document to SAP via PI RLINK PSEG T&D CBM
Alerts / Notifications • PI-ACE Algorithms monitor real-time & weekly inspection data • Creates emails and SAP notification • Examples: • Excessive LTC Operations • High GCB Temperatures • Low GCB Pressure • Low Transformer Oil Tank Levels • Low Nitrogen Cylinder Pressure PSEG T&D CBM
Critical Success Factor • Right Vision (Business & Technical) • Organizational Changes to support system • LOB Control • Change SME thought process • Tied success directly to SME and Asset Engineers Goals • Constantly Measuring Inputs PSEG T&D CBM
Q&A PSEG T&D CBM