Download
1 / 24
240 likes | 304 Views
Misurare il tempo di esecuzione. MPI prevede delle primitive che permettono di identificare una parte di codice e misurarne il tempo di esecuzione /* Dichiarazione delle variabili*/ double starttime, endtime; ... starttime = MPI_Wtime(); /* Codice */ endtime = MPI_Wtime();

E N D
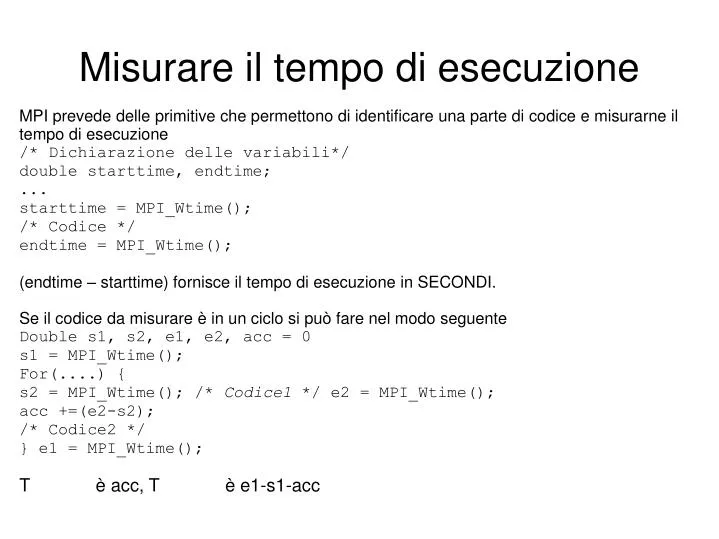
Misurare il tempo di esecuzione MPI prevede delle primitive che permettono di identificare una parte di codice e misurarne il tempo di esecuzione /* Dichiarazione delle variabili*/ double starttime, endtime; ... starttime = MPI_Wtime(); /* Codice */ endtime = MPI_Wtime(); (endtime – starttime) fornisce il tempo di esecuzione in SECONDI. Se il codice da misurare è in un ciclo si può fare nel modo seguente Double s1, s2, e1, e2, acc = 0 s1 = MPI_Wtime(); For(....) { s2 = MPI_Wtime(); /* Codice1 */ e2 = MPI_Wtime(); acc +=(e2-s2); /* Codice2 */ } e1 = MPI_Wtime(); Tcodice1 è acc, Tcodice2 è e1-s1-acc
Strumenti automatici per l’analisi delle prestazioni e del comportamento di programmi MPI • MPE: MPI Parallel Environment • Main components: • A set of routines for creating log files for examination by graphical visualization tool jumpshot4 • A shared display parallel X graphics library • Routines for sequentializing a section of code being executed in parallel • Debugger setup routines • Log files format: SLOG-2 Scalable Log
Profiling Libraries: • MPIProfiling interface Accumulation of time spent in MPI routines; • Automatic Logging generates file of timestamped states • Customized logging • 1 + 2 triggered on occurrence of MPI calls; • 3 triggered on occurrence of user defined states/events
JUMPSHOT-4 viewer of SLOG-2 files • Big log files (Gigabytes); • Support level of details scroll up and down; zooming • High level abstraction preview drawable summarize real entities; • Timeline canvas • Timeline vs time coordination system • Each point in the canvas is identified by two numbers: a timestamp and a timeline ID
Two kinds of drawable objects: • Primitive the simplest drawable, the basic elements of SLOG-2 files • Categorized wrt their topology • “state”, “arrow” and “event” • state and arrow are identified by two points in the timeline canvas (hence two pairs): • State start timeline ID= final timeline ID • Arrow may have final timeline different from initial • Event identified by only one point • Composite is a collection of primitive or other composite drawable provides level o detail • Preview drawable provides high level description of what is going on.
Edge detection • Ogni processo è responsabile dell’elaborazione di una porzione dei dati di input: • Durante la fase di input i dati sono acquisiti in parallelo per blocchi di righe • Nella fase di computazione processi “vicini” scambiano i bordi dei dati contigui • Tale scambio viene iterato ad ogni passo di un ciclo for presente nel codice • Durante la fase di output i dati vengono raccolti in parallelo in un unico file
f( ) f( ) f( ) Edge detection • Esempio su 4 processi:
Comunicazioni • Preview arrow: rappresenta le comunicazioni tra due preview state. • Messaggio: indica le informazioni della singola comunicazione
Come ottenere questi dati • Prima di tutto bisogna compilare il codice così mpicc -c nomefile.c mpicc -o nomefile -mpilog nomefile.o [altri .o] • Dopo l'esecuzione troverete un file nomefile.clog • Si lancia il tool jumpshot edge.clog • Se viene chiesta la conversione fatela