Download
1 / 29
290 likes | 475 Views
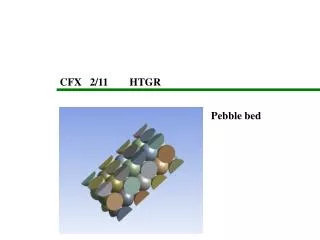
HTGR- Netflow. or, how to know what your network really did without going broke Michael W. Lucas mwlucas@blackhelicopters.org GKN Driveline North America, Inc. What is the Problem?. The network is more and more important The network is invisible It's easy to blame the network

E N D
HTGR- Netflow or, how to know what your network really did without going broke Michael W. Lucas mwlucas@blackhelicopters.org GKN Driveline North America, Inc.
What is the Problem? • The network is more and more important • The network is invisible • It's easy to blame the network • Ignorance of TCP/IP is rampant • “The T1 is full? Full of what?” • “What broke?” “Absence of evidence” != “evidence of absence”
What is the Solution? • Know what happened on the network! • Netflow is summary of historical network traffic. • Tcpdump of all your switches might be better, but badly searchable and takes a lot of storage.
What Is a Flow? • “A unidirectional sequence of packets all sharing the same source and destination IP address, source and destination port, and IP protocol.” • Each TCP connection is two or more flows, at least one in each direction. • Also known as “session-level data.”
What is Netflow? • Netflow is a suite of tools and protocols for collecting, managing, and reporting on flow records. • Netflow components can be mixed-and-matched as desired
What Netflow Gives You • Who talked to who? • How much was said? • What port did they talk on? • What protocol did they use? • What TCP/IP flags did they use? • All the history you have disk for
What Netflow Doesn't Give You • The contents of the conversation • You can see that you transferred 10kB out via HTTP, but not the contents of that data • Alarms (at least, not directly) • Decent Mailing List Archives
Netflow record versions Netflow comes in many different versions: • v5: today's lowest common denominator • v7: switching information • v9: sings, dances, does the dishes, IPv6 You don't care which one you have, so long as you have it.
Netflow Architecture • Sensor(s) • Collector(s) • Analysis System(s) These can be on the same system, or all on different systems, depending on available hardware and network architecture.
the sensor • A program or device that sniffs the network • Aggregates and condenses tcpdump-style information into flow records • security-sensitive device • very few system resources required • flow records are flung across the network • sensitive to network loss
the collector • The software that catches records flung by the collector • Stores the flows in files on disk • Managing those flow files is your problem, not the collector software's. • 5Mb/s uses 2GB disk/month
the reporting system • Data files are nice, but you need to get information out of them. • Choice of graphical or text reports • Must have flexibility to transform and aggregate data in any way you desire.
Where to place each component? • Sensor in a place you want to collect data from • Collector in a secure environment • Reporter only needs read access to collector files
Simple Network Two sensible collector points: inside & outside
Implementing the Sensor • Choose your platform first, based on what you have • Some Cisco switches, most routers speak Netflow natively • Juniper speaks cflowd, aka Netflow v5 • Implement on UNIX via softflowd (http://www.mindrot.org/softflowd.html)
implementing the collector • The sensor throws stuff at the net, the collector catches it and stores it to disk • Collector and reporting system are linked • Need a secure system! • Many flow collectors available: • flowd (developed by softflowd developer) • cflowd (obsolete) • flow-capture (part of flow-tools)
flow-tools history • For many years, the standard toolkit • Was neglected, has recently risen from the dead • Original version is not 64-bit clean, new version is • Not all tools interoperate well with new version yet
Which version? • Old version: http://www.splintered.net/sw/flow-tools/ • New version: http://code.google.com/p/flow-tools/ • When you need flowscan or Cflow.pm, use old version on i386 until new version has fixed Cflow.pm. • Otherwise, use new version
Implementing Reporting • Lots available, but most extensive by far is based on flow-tools • Cflow.pm is older, but lots of tools built around it • integrated with flow-capture
Cflowd Warning • Cflowd is the primary predecessor of flow-capture. • It is obsolete, deprecated, and referred to in many online documents. • Cflowd does not build easily on amd64 (requires gcc 2.9) • You do not need Cflowd. • You do need Cflow.pm, a different tool! • May have to hack package management or build system
testing with flowdumper Cflow.pm includes flowdumper(1), a simple flow file query tool. If flowdumper works, you have successfully installed Cflow.pm and may continue # flowdumper -s ft-your-flow-file-here 2005/04/28 19:14:01 172.16.30.247.80 -> 216.98.200.250.63647 6(SYN|ACK) 3 144 2005/04/28 19:14:01 216.98.200.250.63647 -> 172.16.30.247.80 6(SYN) 1 48 ...
Report Systems • Flowscan: Web-based CGI: http://net.doit.wisc.edu/~plonka/FlowScan/ • Flowtracker – Web based, ad-hoc reporting: http://ensight.eos.nasa.gov/FlowViewer/ • Flow-print, flow-stat, flow-nfilter: flow-tools, text-based • Flowdumper: Cflow.pm command line, uses Perl on command line
CUFlow: FlowScan Module It's the quickest route to pretty pictures.
Flow-Tools • Use flow-cat to open raw (binary) flow files • flow-print will print them out much like flowdumper(1). flow-cat ft-*| flow-print • Default format much like flowdumper -s, but calls bytes “octets”.
flow-print output Default Format: srcIP dstIP prot srcPort dstPort octets packets 63.85.32.4 208.109.209.156 6 58943 80 1145 12 208.109.209.156 63.85.32.4 6 80 58943 12081 12 ... -f 1 Format: Sif SrcIPaddress DIf DstIPaddress Pr SrcP DstP Pkts Octets StartTime EndTime Active B/Pk Ts Fl 0000 63.85.32.4 0000 208.109.209.156 06 e63f 50 12 1145 1016.12:09:58.042 1016.12:09:58.995 0.953 95 00 1b 0000 208.109.209.156 0000 63.85.32.4 06 50 e63f 12 12081 1016.12:09:58.042 1016.12:09:58.995 0.953 1006 00 1b ...
flow-nfilter • “What is the most heavily used port on this server?” • “Who is connecting from this foreign network?” • “What sort of traffic are we seeing from this application?” Filtering can answer all of these easily.
using filters Specify the filter definition with -F filtername flow-cat ft-* | flow-nfilter -F allmail | flow-print Concatenate filters to make more complex queries on the fly flow-cat ft-* | flow-nfilter -F allmail | flow-nfilter -F washdc-office | flow-print
How Not To Go BOFH • You have evidence, you can afford to be generous • “Here is the evidence that shows that the network is working. I am, however, happy to help you diagnose and troubleshoot the problem you are having with your application.”