Download
1 / 80
800 likes | 877 Views
DOS-RESPONSE JAPAN NUCLEAR RADIATION.

E N D
DOS-RESPONSE JAPAN NUCLEAR RADIATION Measuring the impact of nuclear activities begins with measuring the effluence from the industry into air and water and retained radioactive waste, the distribution of this debris in the biosphere over space and time; its uptake in the ecosystem and food web and its persistence in the biosphere; together with transfer factors in the environment; human uptake, physiological distribution in the body and biochemical properties; energy deposits; dose estimates to the public and workers; and the human and environmental health implications of this exposure. Some method for quantifying the impact on living systems is necessary to relate concentration levels to health effects.
Recommendation • Regardless of the nature of fires or detonations of high explosives in nuclear weapons, the major radiological threat will be the release of plutonium. When associated with a fire, metallic plutonium may burn, producing radioactive plutonium-oxide particles, which may present serious hazards if inhaled or deposited in wounds. Also, detonation of the high-explosive component in nuclear weapons may pulverize plutonium into very small particles, which can cause contamination over a large area. If the high explosives burn instead of detonating, the amount of plutonium dispersed into the atmosphere usually is small and represents a serious health hazard only in the immediate area and from the smoke cloud. Plutonium is not a radiation hazard if it remains outside the body, because it is an alpha-emitter. While alpha particles have a very short range and lack the ability to penetrate the skin, plutonium contamination can be a very serious hazard if inhaled or ingested.
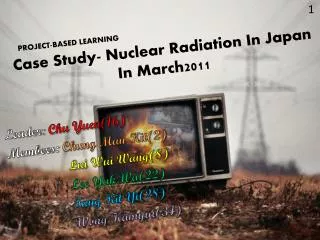
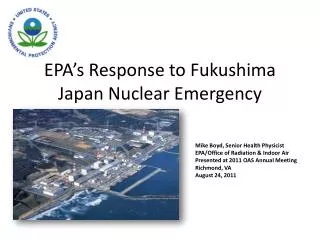
RISK CHARACTERIZATION • In a narrow sense, risk characterization is an integral component of risk assessment process and involves complex and value-related judgments [1]. • Based on hypothetical exposures considered, life-threatening damage could reach the possible or likely range if the worker is exposed to a very large gamma spike during a work shift, say owing to a hydrogen explosion. The Fukushima Disaster • A radiological emergency situation currently exists at the Fukushima Dai-ichi (No. 1) nuclear power station (NPS) in Japan as a result of the Mar 11, 2011, magnitude 9.0 earthquake, which triggered a massive tsunami that killed thousands of Japanese citizens • If a person is exposed to a large gamma dose delivered to the entire body, cells in irradiated tissues can be destroyed in large numbers. This can lead to deterministic radiobiological effects
Modeling Methods • The cumulative normalized dose is indicated by , and for a given absorbed radiation dose differs for different deterministic effects.
Risk managment • Yamashita kept repeating that the radiation dose between 10 to 100 millisievert (mSv) was an “uncertain” level, whereas the dose over 100 mSv was associated with a dose dependent cancer risk throughout life. • “Evacuation – Most people within 20 kilometers of the nuclear power plant were rapidlyevacuated • Moreover, in terms of iodine tablet intake for children, refer to the disaster manual and administer iodine syrup. Also, for individuals over age 40, administer stable iodine tablets only if they want to.” If radioactive particles exist, worry about rain • . For the amount of radioactivity in Tokyo area, rain is important to wash out such kind of fallout in this area. • Production of food was stopped, locally produced food was no longer distributed outside Fukushima or even from Ibaraki • Distribution of food was indeed halted during the acute stage, but over time this protocol was relaxed, with rice grown in contaminated areas being sold to wholesalers or mixed in with uncontaminated rice for distribution to food industry, destined for hospital food and school lunches.
ENVIRONMENTAL RISK ASSESSMENT OF OCEANIC OIL SPILL Somya Singla Harsh Arya Kshitij Mittal CEL899
RISK IDENTIFICATION • For spill, we need to estimate: • The duration of input • The rate of dispersion • The period of time over which the components will persist • The concentrations at which biological effects will and will not be observed • For the fate of the material, consider its: • Environmental component (water, air, sediment) • Form in which it’ll be present • Concentrations • Information to be collected: • Types of oils frequently stored in, or transported through, that area • Locations where oil is stored in large quantities and the mode of transportation used to move the oil • Extreme weather conditions • The location of response equipment and personnel trained to use that equipment and respond to the spill swifty
Vulnerability analysis information: • List of public safety officials in the community • List of facilities such as primary health centres, nursing homes and hospitals • List of recreational areas, such as camping grounds • List of critical habitats that can be affected when a spill occurs • Identification of parts of the environment that are particularly susceptible to oil or water pollution • Direct impacts • Localized nutrient enrichment • Saprogenic effects • Temperature increase • Pollution from oils and chemicals • Oil: toxic initially, later emulsifies • Diving sea birds encounter floating oil • Evaporation of lighter fuel oil fractions • Near-shore oil spill more dangerous than offshore
IMPACT OF OIL SPILL Risk assessment matrix for oil spill • Oil: contains hydrocarbons • Can affect air quality • Potential fire hazard • Effect on recreational areas, harbors, industries, commercial fishing grounds and tourist attractions • Effect on marine life: • Cut-off of oxygen from atmosphere • Marine food chain affected • Aquatic flora & fauna killed & damaged
CONTINGENCY PLAN • First step towards effective oil spill response • Aspects: sources of spillage, prevailing risk with possible size, maximum rate of oil discharge, likely reasons, types of oil handled, oil characteristics, spill movement data, trajectory, fate of the spilled oil through time, mechanical recovery plan, application of dispersants, sensitivity mapping and logistics • Response actions: • Notifying all private companies or government agencies • Getting trained personnel and equipment to the site quickly • Defining the size, position and content of the spill, direction and speed of movement, likelihood of affecting sensitive habitat • Ensuring the safety of all response personnel and the public • Stopping the flow of oil and preventing ignition • Containing the spill to a limited area • Removing the oil • Disposal of oil once removed from the water or land
HUMAN HEALTH RISK ASSESSMENTofHEAVY METALSfromBHALASWA LANDFILL Balsher Singh Sidhu (2009CE10292) DikshantSharma (2009CE10297) Smit Gupta 2009CE(10344) TusharTuteja(2009CE10351)
Introduction • Bhalaswa Landfill: • North Eastern part of Delhi • 21.06 acres • Unlined, so hazardous leachate situation • 2200 tonnes of waste per day • Health Hazards: • Leachate contaminated groundwater, used for consumption without proper treatment • Focus of this study: Heavy metals • Methodology: • Reviewed research papers on landfills & heavy metals • Study by “Bhalaswa Lok Shakti Manch”; chose Zinc and Lead
Hazard Identification: • Lead: • Affects children more than adults: reduced IQ, stunted growth, impaired hearing, kidney damage, death. • Among adults: fertility problems, nerve disorders, muscle pain, memory problems, nausea, diarrhoea, weight loss, gastrointestinal disorders. • Lack of studies to document its carcinogenic effects. • Zinc: • Indirectly causes copper deficiency, leading to anaemic symptoms, like fatigue and weakness. • Irritates the intestinal tract, causing nausea, vomiting, diarrhoea, appetite loss, fever, loss of consciousness.
RISK ASSESMENT ON MINAMATA DISEASE (JAPAN) BY DEVENDER KUMAR AND GROUP MEMBERS.
STEPS FOLLOWED DURING RISK ASSESMENT. CAUSE OF MINAMATA DISEASE WAS METHYL MERCURY POISIONING IN MINAMATA BAY IN JAPAN AND RESULTS IN MINAMATA DISEASE TO LACALITY PEOPLE. 1. - HAZARD IDENTIFICATION :- SINCE IT WAS OFFICIALLY DISCOVERED IN 1956 THAT DANGEREOUS MINAMATA DISEASE WAS CAUSED BY METHYL MERCURY POISIONING AND NEEDS A WAY TO COME OUT. SO THERE WAS NO ISSUE OF IDENTIFICATION OF HAZARD CAUSED BY METHYL MERCURY POISIONING. THERE WAS TOTAL OF APPROX. 2000 PATIENTS WERE IDENTIFIED AND LATOR ON THAT WAS CONTINUED BECAUSE OF UN AWARENESS OF THEIR GOVERNMENT. 2.EXPOSURE ASSESMENT:- ACCORDING TO AVAILABLE DATA AROUND 67% LOCALITY PEOPLE WAS INFECTED. SO ON AN AVERAGE 65% TIME IN A YEAR POPULATION WAS IN EXPOSURE OF METHYL MERCURY.
DOSE RESPONSE ASSESSMENT The influence of age and sex on the threshold dose of mercury in Minamata disease was studied by dose-response analysis based on mercury concentrations in hair obtained mainly from adults living near the Agano River at the beginning of Niigata Minamata disease outbreak in 1965. The subjects were 174 male and 694 female inhabitants of polluted areas including 55 males and 66 females officially recognized as Minamata disease patients. Symptoms were ataxia, numbness in the hands and feet, general muscle weakness, narrowing of the field of vision and damage to hearing and speech. In extreme cases, insanity, paralysis, coma and death follow within weeks of the onset of symptoms. A congenital form of the disease can also affect foetuses in the womb. One-compartment model is widely used in the EPA for the following reasons: 1 Methylmercury exposure via foods is continuous and relatively stable. 2 Methylmercury is not unevenly distributed to a specific organ in the body. 3 Methylmercury is difficult to metabolize (into inorganic compounds) in the body
ONE COMPARTMENT MODEL Daily methylmercury intake d (μg/kg bw/day), which becomes C (the blood mercury level) (μg/L) in the steady state, is calculated using the following formula: Maternal daily methylmercury intake: d (μg/kg bw/day) d =C × b × V/A × f × bw In this b = elimination rate constant= 0.014 per day bw = body weight =60kg V = blood volume= 0.09×60liters A = fraction of the dose absorbed=0.95 f = the absorbed fraction distributed to the blood =0.05 10 ppm was taken as the NOAEL and the RfD came out to be 2.0μg/kg bw/week of Hg by using the following formula: RfD = NOAEL/VF1*VF2*…VFn where VF is the variance factor. ONE COMPARTMENT MODEL IS FITTED TO ANALYSE IT.
RISK MANAGEMENT AND COMMUNICATION In order to understand the level or magnitude of risk associated with the disease and to create a clear risk perception, it’s good to evaluate it using the following major dimensions: Catastrophic potential- Besides the direct damage to nature and people’s bodies, the damage brought to Minamata by pollution is incalculable. Familiarity- Minamata Disease was reported by the Chisso Corporation Hospital as a strange disease of unknown cause, and was officially discovered in May, 1956. Voluntariness- Since the disease reaches a human body with unconscious ingestion of Methyl mercury poisoned media(food and water), the infection is involuntary Origin- As it is indicated before, the disease is caused by human actions or failures Effects on future generations- Minamata disease is not a hereditary disease. If proper care is in place its effect on future generation is rare.
SREELAKSHMIBABU 2012CEV2267 (GROUP LEADER) KARISHMA BHATNAGAR 2012CEV2274 MEGHA KANOJE 2012CEV2283 SADAF NOORUDHEEN 2012CEV2279 BIKRAM SINGH 2012CEV2285 VARIOUS CONTAMINANTS IN YAMUNA RIVER AND ITS RISK ASSESSMENT
INTRODUCTION The main objective – compare concentrations of metal contaminants present in the Yamuna water (Delhi) with the permissible limits & do risk assessment. Area of study-Yamuna River between Wazirabad barrage and Okhla barrage because drains between them contribute 80 % of total pollution load. The steps done -Hazard identification, exposure assessment, dose – response assessment, risk characterisation, risk management, risk communication
1.HAZARD IDENTIFICATION The metal concentrations in the specific region of Yamuna were obtained.
2. EXPOSURE ASSESSMENT Possible exposure routes are: Ingestion: finished drinking water, Accidental ingestion during recreational activities, Food pathway: consumption of fishes, vegetables grown on the banks, River bathing and washing. Exposed Population- blood lead level when exposed to Yamuna bank area -8 times that in rural area .
3. DOSE RESPONSE ASSESSMENT Chronic Daily Intake=(CW*IR*EF*ED)/(BW*AT); HQ>1 – risk present.
4. RISK COMMUNICATION AND RISK MANAGEMENT Risk Communication Objective-Educating target audience, health professionals, municipal Corporation, improving the quality of information in public domain on the issue. Methods-putting some hoardings near polluted zones, distributing pamphlets, brochure etc to people residing by the river. Risk Management Risk assessors -Analyse are in terms of cost effectiveness.
ENVIROMENTAL RISK ASSESSMENT(CEL899) A REPORT ON “RISK ASSESSMENT ON BOMBAY HIGH OIL SPILL” Submitted by:- Manish Bhardwaj 2011AST3530 Rahul Saini 2011AST3566 Amrendra Kumar 2011AST3564 Pawan Pal 2011AST3563 Rajeev K Singh 2011AST3572 Karanjeet Singh 2011AST3578
INTRODUCTION Bombay high field discovered in 1974 and it is located in Arabian sea 160 km west of the Mumbai coast. The oil operations are run by Oil & Natural gas Corporation. The rupture in pipeline in Bombay high was on 17 may 1993 which results in spillage of crude oil. The exact amount of oil spill is not known, thus spilling roughly expected 3000-600 tonnes of oil into the sea. Oil continued to leak out of the pipeline at the rate of around three barrels per minute.
To identify immediate change if any in marine environmental quality of Murud in the event of pollution by petroleum hydrocarbon residue. Water samples were collected at different depths for dissolved-dispersed petroleum hydrocarbon residues (DPH) using Niskin water samplers All the water samples were analysed for their DPH by spectrofluorometry after preconcentration by hexane extraction. Objectives :-
Result The sizes of oil patches were estimated to vary between 1x 0·5 m to 10 x 2m. Only onepatch of untreated oil (about 100 x 2 m) was observed Aerial survey carried out on 25 May however showedseveral oil patches of varying sizes drifting towards thecoast of Murud-Zanzira, south of Bombay. Table 1:: Comparison of data of floating tar ball and DPH concentration
Table 2::Data on chl a, phaeophytin and primaryproductivity in the oil spill area.
Observational Impact Localized impacts in terms of decrease in its rate of primary productivity and changes in the composition of zooplankton were evident . The beach tar melted under the summer heat and percolated into the sand spreading the contamination at least up to 5 cm below surface.
CEL 899-ENVIRONMENTAL RISK ASSESSMENTRISK ASSESSMENT OF BHOPAL GAS TRAGEDY GUIDED BY SUBMITTED BY Dr. ARUN KUMAR RAVEEN PPATEL (ENTRY NO.-2012CEW2296) AMIT KUMAR VYAS (ENTRY NO.-2012CEW2289) PARAG AGRAWAL (ENTRY NO.-2012CEW2292) HARSHA YADAV (ENTRY NO.-2012CEW2297) DEPARTMENT OF CIVIL ENGINEERING INDIAN INSTITUTE OF TECHNOLOGY –DELHI NEW DELHI-110016
INTRODUCTION: - The incident took place in the mid night of 3rd December 1984. It was one of the greatest industrial disaster ever happened. During the incident 40 tones of MIC ( methyl isocyanate ) and various products such as mono –methyl amine , hydrogen cyanide and other lethal gases were released from UNION CARBIDA CORPORATION pesticide factory in Bhopal, India which flooded the atmosphere of Bhopal.The immediate effects on the people due to the exposure were vomiting, headache, burning of lungs and searing in their eyes. Within 72 hours of the incident about 8,000 people had died and total of 25,000 have since died due the released gases. METHODOLOGY Hazard identification Exposure assessment Dose response assessment Risk characterization Risk communication
RESULTS Effect On society:- After 28 years after the bhopal gas tragedy the victims continue to suffer from problems like mental retardation cerebral palasy and multiple disabilities. Economically they became very week only 70% of the exposed population were earning minimal wages. Ground water became polluted as tones of toxic substance are underlying under ground. It was noticed that a large amount of heat was generated during the release of MIC. It is known that MIC reacts with moisture rapidly. In addition, MIC could have undergone a series of chemical reactions. They are still carrying the load of the past hazzards on their shoulders.
METHODOLOGY Hazard identification: During this disaster various gases like CO, HCL, CO2, HCN, Mono Methyl Amine, MIC(methyl isocyanate) were released. Incident took place mainly due to release of MIC and its reaction products. Having such a pressure that it rises up to 33 meter from the ground. Due to prevailing wind and temperature conditions the gas was taken from release valve to the residential areas of the city. Exposure assessment:. Initially it was due to respiratory tract and eyes, and for long term it was through the GI tract from ingestion of food and water. A number of contaminants still remain on site. So it would be difficult to link an illness specially to MIC leak exposure. The leak itself lasted for 90 minutes. However the gas remained in the area for many hours after the leak. Between 210-270 min after the release of the gas, it mixed with the air, cooler and descended on the city still moving downwind.
. Dose response: After lot of studies it has been found that MIC(methyl isocyanate) is of non-carcinogenic nature. CalEPA(California Environmental Protection Agency) calculated a chronic inhalation reference exposure level of 0.001 milligrams per cubic meter (mg/m3). Refrence limit/refrence dose:A chronic non-cancer Reference Exposure Level (REL) of 3.6 x 10⁻¹ µg/m3 is listed for methyl isocyanate in the California Air Pollution Control Officers Asociation. Symptoms may include cough, chest pain, shortness of breath, watery eyes, eye pain (particularly when exposed to light), profuse lid edema, and corneal ulcerations. Respiratory symptoms such as pulmonary edema and bronchial spasms may occur in immediate response to exposure or develop and progress in severity over a period of hours to days post-exposure.
. Risk characterization: SEVERE EFFECTS: Initial effects of exposure were:Coughing,Vomiting, Severe eye irritation, Feeling of suffocation Acute symptoms were:-Burning in the respiratory tract and eyes,Blepharosphasm,Breathlessness,Stomach pains and vomiting. Causes of death were:Reflexogenic circulatory collapse,Pulmonary oedema,Tubular necrosis of kidney,Fatty degeneration of liver. Risk management:It was suggested to people to close there windows and doors and spread the water to their floors and lay down on the floor. The State Government established a number of hospitals, clinics and mobile units in the gas-affected area to cure the victims.
CEL 899: Oil Spill Risk Assessment Name Entry Number Arnav Kumar Guha 2012CEV2268 Samarpreet Singh 2012CEV2270 Swaagat Das 2012CEV2275 Dheeraj Chaudhary 2012CEV2284 Govind Narain 2012CEV2280 Neeraj Golhani 2012CEV2281
Oil Spill Risk Assessment Introduction Oil spill is release of liquid petroleum, hydrocarbon into the ocean or coastal waters, due to human activity, mainly: Sinking or leakage of oil carrying vessels or oil pipelines. Countries at war Illegal damping by industries Terrorist activities Natural disaster The oil spill basically covers the surface of water by a thick film and thereby Effects the entire marine life Fishes die, because they cannot breathe Nature takes up to 10years to recover. if oil reaches the sea beds
Methodology Our study will focus on risk assessment due to oil spill and taking BP’s oil spill’s as a prime case example. The study will be having following steps: • Study of major oil spills • Establishing the system Boundaries • Risk assessment through : • Hazard Identification • Frequency Analysis • Consequence Analysis • Risk Evaluation and Calculations • Suggesting mitigation strategies
Fault Tree of a oil spill Risk Perception Psychometric Map Location of risk in factor space (based on Slovic et.al)
Frequency Analysis Frequency analysis is important as it enables us to estimate the probability of another oil spill based on trends of spill accidents in time for example the following graph [Source :www.itopf.com/stats.html ] shows that in the coming decades the number of spill will be less than 7.3 spill per ten year: Figure 3:International Oil spill trends
Risk Communication The main part of risk communication includes bridging the gap between the actual facts and scientific revelations with the perception of the people to be affected. In case of oil spills, the risk communication should primarily include: • Making the people aware of the exact scale and circle of loss due to the mishap. • Analysing and discussing the future related occurrences (if any). • Making the communicators aware of the various standard allowable guidelines related to the spill, as led down by the concerned authorities. • Circulating proper preventive suggestions and controlling measures which ought to be taken by the audience on their own and also helping them implementing those techniques. • Assuring the people of the measures being taken on behalf of the organization as a whole in order to counter act and minimize the losses, if possible. • Making publis certain important figures related to the mishap like- • Origin of the spill • Cause(s) and there proper and understandable analysis. • Degree of occurrence • Areas most adversely affected • Maximum people and property expected to have been affected • Time expected to be need for complete rehabilitation