Download
1 / 37
370 likes | 528 Views
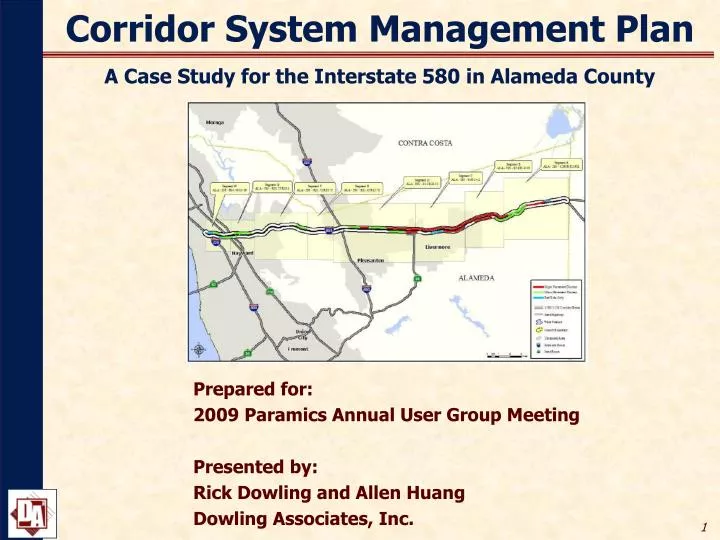
Corridor System Management Plan A Case Study for the Interstate 580 in Alameda County. Prepared for: 2009 Paramics Annual User Group Meeting Presented by: Rick Dowling and Allen Huang Dowling Associates, Inc. Introduction & Objective. Project Sponsored by

E N D
Corridor System Management PlanA Case Study for the Interstate 580 in Alameda County Prepared for: 2009 Paramics Annual User Group Meeting Presented by: Rick Dowling and Allen Huang Dowling Associates, Inc.
Introduction & Objective Project Sponsored by Metropolitan Transportation Commission (MTC), and Caltrans, California. Objectives: Identify Problems Along Corridor Recomend Mitigation Strategies Prioritize Sequence of Implementation
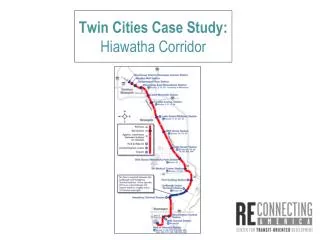
The Corridor 33 miles long I-580, I-238, between I-880 and I-205 I-580 Corridor Characteristics Interregional Truck and Commuter Corridor Inbound peak in morning Outbound peak in afternoon
Original 12 Months ScheduleReduced by 50% to 6 months MAJOR CHALLENGE
Model Selection Paramics for Freeway Microsimulation Synchro/SimTraffic for Arterial Operations CUBE for Travel Demand Forecast
Models (1) Regional Travel Demand Model Implemented in CUBE 30 year forecasts, Freeway OD Regional travel impacts Mode choice impacts
Models (2) Paramics for Freeway Microsimulation Split into two models (Two humans instead of one) Surface street signals only roughed in (Paramics does not do actuated, easily)
Models (2) “Big” Subarea “Small” Subareas
Models (3) Paramics for Freeway Microsimulation Split into two models (Two humans instead of one) West Model Overlap East Model
Models (4) Surface street signals only roughed in (Paramics does not do actuated, easily)
Models (5) Synchro for Arterial Operations Coded models available fromcities Freeway only roughed in Synchro doesnot do rampmetering
Models (6) Feedback Between Synchro and Paramics Zone Signals Meter Freeway Meter Signals Zone
Data Collection Counts Caltrans Data New Data Collection: Same Day to Maintain Continuity Freeway Performance Measurement System (PeMS) Floating Car Travel Time Survey 511.org Travel Time Data – FasTrak Transponder
MTC 511 data-1 • The mean of the 511 travel time data for each hour was computed based on the travel time observations for each minute (60 computations per hour) collected for 24 days. For each hour of the day, a total of 1,440 (=24×60) computations were used to perform the travel time statistics. • Travel times provided by this source represent the average travel times of all vehicles with FasTrak transponders across all lanes of travel. Therefore, both the mixed-flow lane data and carpool lane data are grouped together.
MTC 511 data-2 • Sample FasTrak Detections During Weekdays Detection of I-680 southbound from South of I-580 interchange to South of SR-84
Trip Table Estimation – Existing • Balanced Peak Period Counts for the Corridor • CUBE Matrix Estimation Module • Assign Importance Factor for Key Locations • Paramics Utilize Peaking Profile
Model calibration and Validation Paramics freeway corridor was calibrated and validated to bottleneck locations, causations, queues, duration of congestion, travel times, and throughput volumes. Synchro was checked for reasonableness for level of congestion and queues. Travel Demand Model was validated to match existing 2008 traffic counts for peak period.
Paramics Model Calibration & Validation-1 • Bottleneck Location and Queue Length, Causation • Travel Times • Traffic Volumes • FHWA Guideline
Exhibit 8: Illustration of Paramics Simulation: Real Time Simulated Speed Color Coding Exhibit 9: Illustration of Paramics Hotspot Paramics Model Calibration & Validation-2
Analysis of Alternatives (1) • Too many alternatives and variations • Combined into baskets • Evaluated baskets • The baskets • 2008 Existing Conditions • 2015 Base Case (Funded Projects) • 2035 Base Case (no improvements after 2015) • Evaluated using demand and simulation models
Analysis of Alternatives (2) • Development of Alternative Strategies • Three levels of effort • Do the least • Let congestion worsen, but keep congestion within Peak Period. (The baby bear alternative) • Do a bit more • Do not let congestion worsen, return it to 2008 levels • (The mama bear alternative) • Do a lot • Eliminate all congestion (The papa bear alternative) • Sketch planning model to construct alts.
Analysis of Alternatives (3) • Creating the Sketch Planning Tool • Spreadsheet with • 5 Hour Unconstrained Demands and • Existing geometry and capacities • Calibrate delay estimates to match Simulation for base case 2015 • Constructing the Three-Bears Strategies • Use Sketch planning model to build baby bear first. • Add to baby bear until achieve mama bear • Add to mama bear until achieve papa bear
Analysis of Alternatives (4) • Select hybrid of the three bears as recommended improvement plan. • Add in active traffic management measures • Evaluate recommended improvement plan in demand and microsimulation models. • Simulation models not used to test alternatives and variations of alts. • Simulation used to evaluate final recommended plan and generate MOE’s.
Development of Scenarios - 2 Freeway Management and Operations Improvements Surface Street Management and Operations Improvements Freeway Capacity Improvements Surface Street Capacity Improvements Transit/Pedestrian/Bicycle Improvements Gateway Constraint
Recommendation of Strategies Exhibit 14 provides a summary of corridor-wide freeway performance measures comparison between existing conditions, baseline programmed scenario, as well as the scenario with recommended strategies.
Challenges and Lessons Learned - 1 Consultants Utilization of Different Models traffic operational analysis are completed using two independent software tools – Paramics and Synchro/Simtraffic provided most the economical and efficient approach to complete the study in a timely manner. Sketch Planning Tool for Initial Assessment Excel spreadsheet planning tool was used to achieve the mobility goal. The ACCMA model’s forecasts for 2015 and 2035 were adjusted link-by-link (separately for each peak period) according to the difference between the model forecasted peak period demand for 2008 and the count. Utilization of this sketch planning tool greatly accelerated the study scheduled, and eliminated unnecessary effort of redundant or unrealistic microsimulation model runs.
Challenges and Lessons Learned - 2 Public Agencies Metropolitan Transportation Commission (MTC) A major challenge with this project was that funding constraints necessitated an extremely condensed project schedule. Schedule constraints also made addressing deliverable comments more challenging. However, this was a crucial component of this study to ensure that an agreed upon roadmap for the corridor was reached among the stakeholders, etc. California Department of Transportation District 4 (Caltrans) Selection of consultant with expertise in both microsimulation and traffic engineering was crucial in this study. An advantage of two model approach for operational analysis is that many local jurisdiction engineers are not familiar with Paramics microsimulation, but are very familiar with Synchro/SimTraffic, yielding one less "black box" or unfamiliar technique for local engineers to question. As part of existing data collection, aerial photography might prove valuable in corridors where Caltrans intend to implement ramp metering, etc.
Questions and Contact Info Questions Rick Dowling, Allen Huang Dowling Associates, Inc. 180 Grand Avenue, Suite 250 Oakland, CA 94612 (510) 839-1742 rdowling@dowlinginc.comahuang@dowlinginc.com www.dowlinginc.com