Download
1 / 53
560 likes | 793 Views
Enhanced Physico-Chemical Characterization of Candidate Compounds. using the pK a Analyzer PRO ™. Challenges in Drug Development. Increasing cost of drug development $0.9 to $1.3 billion per successful drug

E N D
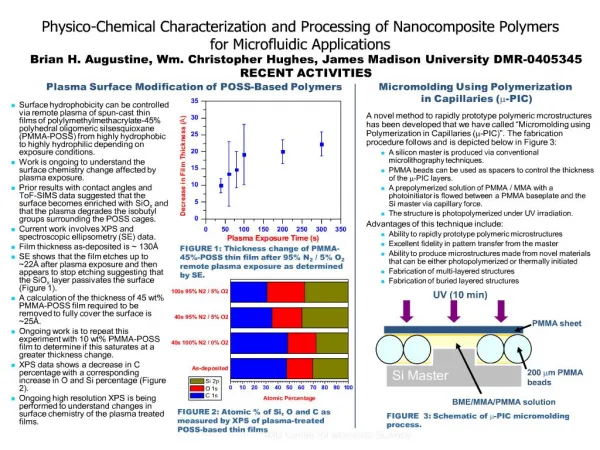
Enhanced Physico-Chemical Characterization of Candidate Compounds using the pKa AnalyzerPRO™
Challenges in Drug Development • Increasing cost of drug development • $0.9 to $1.3 billion per successful drug • Clinical testing is very expensive; hence, want only high-probability leads entering this phase. • Large libraries of candidate compounds have been created from combinatorial chemistry • Characterization of these leads is causing major increases in analytical work loads
Changes in Drug Development Process • Adopt strategy of “fail often, but fail early” • Characterization of candidates as early as possible • Eliminate “drug duds” very early in the process • Perform physicochemical testing earlier in the drug development process • ADME (Adsorption, Digestion, Metabolism, Excretion) • Toxicity
Why Physicochemical Properties? • Many physicochemical assessments are labor-intensive, and hence, are delayed until “hits” are turned into “leads” • Unsuitable physicochemical properties account for up to 30% of drug failures • Earlier determination of physicochemical properties will generate better qualified candidates to clinical testing – provided the screening can be made cost-effective. • Need new tools and technologies
90-95% of Development Cost occurs in the Clinical Trials Phase Drug Discovery Process 0.5-1 Year 1-2 Years 1-3 Years 6-8 Years Lead Optimization Clinical Trials Basic Research Target Identification Target Validation Lead Identification Market Disease model hypotheses Exploratory Research Characterize genes & proteins as candidates in the disease process Discriminate valid from invalid biological targets HTS Screening of leads Evaluate leads for optimal pharmacologic efficacy & selectivity L E A D S 10,000 500 10 1
With better early characterization of leads, significant cost savings are achieved Drug Discovery Process 0.5-1 Year 1-2 Years 1-3 Years 6-8 Years Lead Optimization Clinical Trials Basic Research Target Identification Target Validation Lead Identification Market Disease model hypotheses Exploratory Research Characterize genes & proteins as candidates in the disease process Discriminate valid from invalid biological targets HTS Screening of leads Evaluate leads for optimal pharmacologic efficacy & selectivity L E A D S 10,000 500 3 1
Key Physicochemical Parameters • Solubility • pKa (Acid-base dissociation constant) • Partition coefficient (log Pow, log D, …) • Permeability (Caco-2, PAMPA, …) • Integrity
Key Physicochemical Parameters • Solubility • pKa (Acid-base dissociation constant) • Partition coefficient (log Pow, log D, …) • Permeability (Caco-2, PAMPA, …) • Integrity
pKa : Acid-base Dissociation Constant • The pKa value is a measure of the ionization ability of a weak acid or base: HA H+ + A- Ka = [H+][A-] / [HA] pKa = - log Ka pH = -log [H+] pKa = pH – log ([A-] / [HA]) • From this last relationship, it is seen that the pKa value is the pH at which a compound is 50% ionized ([A-]/[HA] = 1; log 1 = 0)
Physicochemical Properties - pKa • Why is pKa important? • Most all drugs are weak acids or weak bases • The pKa value of a compound strongly influences its solubility, ability to permeate cell membranes, complexation to drug targets, and bioactivity • The pKa value is of fundamental importance in early discovery and development processes for: • Prediction of ADME (adsorption, distribution, metabolism, excretion) • Assessment of potential challenges in formulation/process development • Prediction of chromatographic / electrophoretic separation behavior
pharmaceutical products small intestines stomach colon urine blood 0 2 4 6 8 10 12 cola vinegar orange juice milk bleach Biologically Relevant pH Range for Pharmaceutical Products
High Throughput determination of Physicochemical Properties - pKa • Conventional pKa methods are lengthy and labor-intensive • Potentiometry – requires many hours; mg of pure sample; stringent buffer conditions • UV spectroscopy – requires a chromaphore influenced by charge state; μg - mg of pure sample • HPLC or capillary electrophoresis – relaxes purity demand, but still low throughput (runs at multiple pH values)
- - + – N Bulk Flow: EOF + Vacuum UV + Technology Overview + N - Time • CE-based platform; application of high voltage across capillary filled with aqueous-based buffer • Narrow bore, fused silica capillaries (75 mm i.d., 150 mm o.d.; 55 cm total length/33 cm to detector) • Electroosmotic flow (EOF) provides bulk flow towards cathode at pH > 4 • Application of vacuum provides additional bulk flow to detector at all pH values • Migration time depends on analyte charge-to-mass ratio; neutral compounds migrate with bulk flow • Many publications describe single capillary CE for the determination of compound pKa values, dating back >14 years
Principles of pKa AnalyzerPRO™ Technology • UV light passing through the detection window of a 96-capillary array is imaged onto a linear photodiode array detector • Capillary inlets are arranged 8 x 12 for direct injection from 96-well sample plates; capillary outlets are bundled to a common reservoir enabling vacuum-assisted separation • Different pH buffers are injected into different capillaries of the array prior to separation • Samples are separated by the application of a high voltage with vacuum flow • Separation of compounds from the neutral marker as a function of pH is directly proportional to their charge state, yielding the compound pKa value
Attributes of the pKa AnalyzerPRO™ for pKa Analysis • High Sample Throughput • 96 separation channels allow for the measurement of 8 compounds over 12 pH values, or 4 compounds over 24 pH values in a single analysis • Small Sample Consumption • Approximately 5 mg per sample well required for analysis; typical sample well volume of 50 ml; only nl volumes injected • Separation of Potential Interferents • Sample impurities or degradants possessing different charge-to-mass ratios can be resolved from target compound; compound pKa values can be measured in the presence of UV absorbing counterions • Sample Requirements • Only UV absorptivity at 214 nm required; spectral changes between ionization states not required; exact sample concentration does not need to be known • Multiplexed Format • Provides the capability to effectively span a wide pH range (pH 1.8 to pH 11.2) with good resolution (0.4 pH units) to identify extreme pKa values, deconvolute closely spaced pKa values, and improve confidence in results
pKa AnalyzerPRO™ System Specifications pKa Determination Method:Plot of compound ionic mobility (from migration time vs. neutral DMSO marker) vs. buffer pH value Detection:UV Absorbance at 214 nm; other wavelengths available (chromophore does not have to be in proximity of ionization center) Detection Sensitivity:~10 mg/ml (ppm) depending on chromophore; typical working concentration 50 - 100 mg/ml Sample Volume Required:Typical volume 50 ml/well (minimum volume 20 ml/well); 24 wells per 24 pH point analysis; 12 wells per 12 pH point analysis Sample Format:Typical DMSO concentration 0.1-0.2% (v/v); higher DMSO concentrations can be tolerated at higher wavelengths Sample Purity Requirements:Compound of interest should be major species present; impurities and degradants can often be separated Maximum Sample Throughput:12 – 24 compounds/h (24 or 12 pH points/sample) pKa Determination Range:1.8 – 11.2 Data Export Format:Microsoft Excel spreadsheet
Effective Mobility (Meff) Z Meff = Meff = 6r Ltot = Total length of capillary Leff = Length to detector V = Applied voltage ta = Migration time of analyte tm = Migration time of neutral marker (DMSO) Z = fractional charge on analyte = viscosity of medium r = hydrodynamic radius of analyte Ltot Leff (1/ta – 1/tm) V Relationships between Meff, pH, and Apparent pKa Meff = Monobase: Mb10-pH Ma10-pKa Ma, Mb = Meff of completely ionized species 10-pKa + 10-pH 10-pKa + 10-pH Monoacid: To calculate the pKa value, a regression fit of Meff against pH is performed using the appropriate fitting equation Additional equations can be found in: J. M. Miller et al.Electrophoresis, 2002, 23, 2833-2841. Meff = pKa AnalyzerPRO™: Some Equations for pKa Measurement
- - + + – N Bulk Flow: EOF + Vacuum UV + Technology Overview + N - • Effective mobility determined from the migration time of the solute • The software determines the best fit of mobility data vs. pH to various equations, and selects the proper choice • The data is plotted with fitted line; the pKa values are reported (and can be exported as .csv file) Time
pKa AnalyzerPRO™:Sample and Buffer Tray Configuration for pKa Analysis • 12 different pH buffers are drawn into sets of 8 capillaries • 8 capillaries having the same buffer, 12 capillary sets, each with a different pH value • 8 different samples are loaded in 12 wells across the 96-well plate • 8 different sets of the same sample in 12 wells
Analyte Acyclovir Acyclovir 4-Aminopyridine Sample Tray 4-Aminopyridine Benzoic Acid Benzoic Acid Quinine Quinine Inlet Buffer Tray 7.58 8.41 9.19 2.89 4.41 5.21 6.01 6.84 2.07 3.42 pH 10.00 10.83 Sample and Buffer Tray Configuration for pKa Analysis 12 pH Point pKa Analysis (8 Samples) The marked well (E7) corresponds to benzoic acid analyzed at pH 6.84
Experimental User Interface Screen • User selects experimental mode (12 or 24 point aqueous, 12 or 24 point co-solvent) • Compound names, molecular weights and predicted pKa values (if available) are entered • Buffer pH information file is loaded • Information is saved for pKa calculation and report generation
Results for 4-Aminopyridine (monobase) • 4-Aminopyridine (red cursor) is a basic compound; therefore it migrates before the DMSO neutral marker (black cursor)
pKa Results for 4-Aminopyridine (monobase) • Mobility vs. pH plot yields a titration curve; inflection point corresponds to the pKa value (9.19). • The software automatically predicts the charge of the compound (e.g., monobase or dibase) from its MW and maximum mobility: Charge(4-AP) = +1.09.
Results for Benzoic Acid (monoacid) • Benzoic Acid (red cursor) is an acidic compound; therefore it migrates after the DMSO neutral marker (black cursor)
Results for Benzoic Acid (monoacid) • pKa value = 4.07 • Charge (benzoic acid) = -1.09
Results for Quinine (dibase) • pKa values = 4.29, 8.51 • Charge (quinine) = +1.91
Results for Acyclovir (monoacid/monobase zwitterion) • pKa values = 2.09, 9.17 • Charge (acyclovir) = +0.60; -1.00
Exported Excel Report for Quinine The measured pKa value(s), titration curve, predicted charge, and buffer information are exportable; a structural image file of the compound can be inserted if available
pKa Results Data Table • Each saved pKa result is entered into a sortable data table for easy access to data
pKa Analysis of Tyrosine (monobase/diacid zwitterion) The –COOH pKa value was not observable by UV spectrophotometry • pKa Values = 2.21, 8.79, 10.08 • Charge = +0.71, -1.62
* Procaine * pH Value Effective Mobility (x 106 cm2/V•s) 4-ABA pH 1.78 (Top Left) – pH 6.46 (Bottom Right) Procaine pKa’ Values: 2.20, 9.04 4-ABA pKa’ Values: 2.37, 4.38 + pH 6.82 (Top Left) – pH 11.20 (Bottom Right) + pKa Analysis of a Procaine/4-Aminobenzoic Acid Sample • A 4-aminobenzoic acid hydrolysis impurity (20%) of procaine was present • The pKa values for both species were determined in the same experiment * *
Some pKa Results Obtained with the pKa Analyzer PRO™ • Literature pKa values were reported at ionic strengths from 0 – 150 mM • To date, the pKa values for >100 compounds have been measured • Average SD ± 0.06 units; typical agreement to literature ± 0.2 units or better
pKa Analysis of an Aqueous Insoluble Compound pH 6.80 ppt pH 7.20 ppt MW: 371.5 Calculated log P: 7.88 ± 0.75 Calculated solubility:0.05 mg/ml Measured solubility:0.01 mg/ml Calculated values from ACD I-Lab V. 7 Measured value from Avdeef (2003) • 24-Pt aqueous pKa Analysis at 30 ppm • (30 mg/ml) • Precipitation from solution at pH 6.8 – 7.2 • Sample dilution to detection limit = ppt
Method: • pH values of methanol containing buffers were measured using aqueous standards ( pH) and converted to pH values as previously described* • The pKa’ values are determined for compounds using 30%, 40%, 50% and 60% (v/v) methanol-containing buffers • pKa’ values are plotted as a function of solution dielectric constant ( ) and extrapolated to 0% cosolvent to yield the pKa’ value (Yasuda-Shedlovsky Method) • Four compounds can be run in parallel over 24 pH values or eight compounds can be analyzed over 12 pH values (throughput of 2 - 4 compounds/h) w s s s w s s s s w Cosolvent pKa Extrapolation of Insoluble Compounds * Roses, M.; Bosch, E. J. Chromatogr., A2002, 982, 1-30.
pKa Analysis of Tamoxifen in 30% (v/v) Methanol • Tamoxifen stays in solution when analyzed at ~20 mg/ml in 30% (v/v) • cosolvent buffers
Yasuda-Shedlovsky Extrapolated pKa’ Value for Tamoxifen • Extrapolated pKa’ value = 8.53 ± 0.07 (n = 9) (I = 50 mM) • Literature pKa’ value = 8.58 (Avdeef, 2003) (I = 150 mM)
Cosolvent pKa Results for Test Compounds • Compounds marked (*) required cosolvent due to low solubility; other compounds listed could be successfully analyzed at low concentrations with aqueous buffers on the pKa Analyzer PRO™ system [amiodarone could only be analyzed at 50%-60% methanol] • Overall, the extrapolated pKa’ values agree well with available literature values
Summary • The pKa AnalyzerPRO™ system provides a very rapid method for pKa measurements of drug compounds • Reproducible pKa results in good agreement to literature values can be obtained over a wide range of pH values (1.8 – 11.2) • Impurities, degradants or UV absorbing counterions can be successfully resolved from the target compound • pKa values undetectable by UV spectrophotometry can be successfully measured • Compound charge can be predicted, allowing detection of closely spaced pKa values • A maximum throughput of 24 compounds/h (12 pH points) or 12 compounds/h (24 pH points) can be obtained for aqueous pKa analysis • Insoluble compounds can be analyzed for pKa using methanol cosolvent buffers and linear extrapolation to 0% cosolvent
Literature References • Reviews Describing pKa Measurement by CE • Weinberger R: Determination of the pKa of Small Molecules by Capillary Electrophoresis. American Laboratory 2005, August:36-38. • Jia Z: Physicochemical Profiling by Capillary Electrophoresis. Curr. Pharm. Anal. 2005, 1:41-56. • Poole SK, Patel S, Dehring K, Workman H, Poole CF: Determination of acid dissociation constants by capillary electrophoresis. J. Chromatogr. A 2004, 1037:445-454. Papers Describing pKa AnalyzerPRO™ Core Technology Zhou C, Jin Y, Kenseth JR, Stella M, Wehmeyer KR, Heineman WR: Rapid pKa Estimation Using Vacuum-Assisted Multiplexed Capillary Electrophoresis (VAMCE) with Ultraviolet Detection.J. Pharm. Sci. 2005, 94:576-589. Pang H, Kenseth J, Coldiron S: High-throughput multiplexed capillary electrophoresis in drug discovery.Drug Discovery Today 2004, 9:1072-1080. Reference Book for pKa, log P and Solubility Data Avdeef A: Absorption and Drug Development. Hoboken, NJ: John Wiley & Sons, Inc.; 2003.
Key Physicochemical Parameters • Solubility • pKa (Acid-base dissociation constant) • Partition coefficient (log Pow, log D, …) • Permeability (Caco-2, PAMPA, …) • Integrity
Why is log P Important? • Drugs need to have enough lipophilicity in order to: • Absorb into the bloodstream and cross biological membranes • Interact with proteins and/or receptors • Have a reasonable half-life to carry out their function • However, too much lipophilicity in a drug can: • Limit the mode of delivery • Limit the release of the drug from the formulation • Increase potential toxicity • The majority of marketed drugs possess log Pow values between 1 and 5
– + Experimental Design for MCE-UV log P Screening • Multiplexed, microemulsion electrokinetic chromatography (MEEKC) was employed for indirect log Pow evaluation. • MEEKC is based on the differential partitioning of solutes between an aqueous phase and an immiscible microemulsion (ME) phase comprised of oil droplets + surfactant • More lipophilic compounds favor the ME phase and migrate slower • Order of migration: DMSO (EOF marker), solute, dodecylbenzene (ME marker) Poole, S. K.; Durham, D.; Kibbey C. J. Chromatogr. B2000, 745, 117-126. Figure adapted from http://www.ceandcec.com (Author Kevin Altria)
4 Dodecylbenzene (ME Marker) DMSO (EOF Marker) 5 2 6 3 1 Multiplexed MEEKC Electropherogram for Six-Component log Pow Standard Mixture Standards: 1. Pyrazine, 2. Benzamide, 3. Nicotine, 4. Quinoline, 5. Naphthalene, 6. Imipramine
Typical Calibration Plot Constructed from a M-MEEKC Run • Averaged (n = 4) log k’ values for the six standards were used to construct the calibration plot
MCE-UV log Pow Screening: 96-Capillary MEEKC Data Order of migration in each capillary is DMSO, Solute, Dodecylbenzene
Long Term (> 8 months) Reproducibility of log Pow Values MMEEKC log k' MMEEKC log P ow D Solute n avg. ± SD %RSD avg. ± SD %RSD Lit. log log P P OW OW acebutolol 42 0.41 ± 0.03 7.32 1.80 ± 0.04 2.22 1.71 0.09 1-aminonaphthalene 37 0.71 ± 0.03 4.23 2.31 ± 0.03 1.30 2.25 0.06 2-aminopyridine 34 -0.41 ± 0.01 2.44 0.41 ± 0.01 2.44 0.49 -0.08 aniline 36 -0.12 ± 0.02 16.67 0.90 ± 0.02 2.22 0.9 0 anthracene 6 2.09 ± 0.10 4.78 4.54 ± 0.17 3.74 4.45 0.09 benzamide 50 -0.17 ± 0.02 11.76 0.81 ± 0.02 2.47 0.64 0.17 caffeine 35 -0.59 ± 0.02 3.39 0.11 ± 0.07 63.64 -0.07 0.18 4-chloroaniline 36 0.62 ± 0.03 4.84 2.16 ± 0.04 1.85 1.88 0.28 chlorpromazine 7 2.21 ± 0.04 1.81 4.74 ± 0.06 1.27 5.19 -0.61 chlorthalidone 38 0.07 ± 0.02 28.57 1.22 ± 0.05 4.10 0.85 0.37 coumarin 26 0.22 ± 0.02 9.09 1.48 ± 0.05 3.38 1.39 0.09 3,5-dimethylaniline 15 0.57 ± 0.03 5.26 2.04 ± 0.05 2.45 2.17 -0.13 ethyl p- 36 0.40 ± 0.09 22.50 1.78 ± 0.15 8.43 1.86 -0.08 ethylbenzene 6 1.49 ± 0.01 0.67 3.54 ± 0.01 0.28 3.15 0.39 ethylbenzoate 38 0.97 ± 0.04 4.12 2.75 ± 0.04 1.45 2.64 0.11 hydroquinine 42 1.26 ± 0.06 4.76 3.23 ± 0.10 3.10 3.43 -0.2 imipramine 52 1.86 ± 0.08 4.30 4.23 ± 0.08 1.89 4.42 -0.19 indazole 46 0.38 ± 0.03 7.89 1.75 ± 0.08 4.57 1.77 -0.02 lidocaine 36 0.89 ± 0.04 4.49 2.62 ± 0.03 1.15 2.26 0.36 2,4-lutidine 12 0.31 ± 0.01 3.23 1.60 ± 0.03 1.88 1.9 -0.3 3,5-lutidine 14 0.42 ± 0.02 4.76 1.77 ± 0.03 1.69 1.78 -0.01 α-methylbenzylamine 8 0.24 ± 0.03 12.50 1.48 ± 0.04 2.70 1.49 -0.01 2-methylbenzylamine 12 0.34 ± 0.02 5.88 1.65 ± 0.03 1.82 1.62 0.03 3-methylbenzylamine 9 0.47 ± 0.02 4.26 1.86 ± 0.04 2.15 1.62 0.24 naphthalene 53 1.36 ± 0.07 5.15 3.40 ± 0.09 2.65 3.3 0.1 nefopam 32 1.14 ± 0.05 4.39 3.04 ± 0.04 1.32 3.05 -0.01 nicotine 53 0.18 ± 0.02 11.11 1.40 ± 0.02 1.43 1.17 0.23 nitrobenzene 35 0.40 ± 0.02 5.00 1.79 ± 0.04 2.23 1.85 -0.06 phenanthrene 13 1.92 ± 0.06 3.13 4.29 ± 0.11 2.56 4.46 -0.17 phenylacetate 36 0.18 ± 0.02 11.11 1.41 ± 0.03 2.13 1.49 -0.08 pyrazine 53 -0.96 ± 0.01 1.04 -0.51 ± 0.03 5.88 -0.26 -0.25 pyrene 8 2.21 ± 0.23 10.41 4.75 ± 0.38 8.00 4.88 -0.13 pyrilamine 35 1.18 ± 0.06 5.08 3.11 ± 0.05 1.61 3.27 -0.16 pyrimidine 36 -1.05 ± 0.02 1.90 -0.67 ± 0.03 4.48 -0.4 -0.3 quinoline 53 0.54 ± 0.03 5.56 2.00 ± 0.04 2.00 2.03 -0.03 tetracaine 38 1.42 ± 0.07 4.93 3.52 ± 0.10 2.84 3.73 -0.21
Comparison of Sample Throughput Among Indirect log Pow Methods * 4 of 96 capillaries are used for the standard mixture • Lombardo F.; Shalaeva M.Y.; Tupper K.A.; Gao F.; Abraham M.H. J Med Chem2000, 43, 2922-2928. • Lombardo F.; Shalaeva M.Y.; Tupper K.A.; Gao F. J Med Chem2001, 44, 2490-2497. • Smith J.T.; Vinjamoori D.V. J Chromatogr B1995, 669, 59-66. • Mrestani Y.; Neubert R.H.H.; Krause A. Pharm Res1998, 15, 799-801. • Kibbey C.E.; Poole S.K.; Robinson B.; Jackson J.D.; Durham D. J Pharm Sci2001, 90, 1164-1175. • Jia Z.; Mei L.; Lin F.; Huang S.; Killion R.B. J Chromatogr A2003, 1007, 203-208. • Wong, K-S; Kenseth J.R.; Strasburg, R.S. J Pharm Sci2004, 93, 916-931.
Summary – log Pow • Log Pow can be estimated with good correspondence using micro-emulsion electrokinetic chromatography (MEEKC) • This MEEKC method has been adapted to the pKa AnalyzerPRO™, enabling rapid screening of log Pow values for target drug candidates (46 samples/hr) • Poorly soluble drug candidates can be analyzed using co-solvent method • Calculation and reporting of results is easily accomplished with dedicated software