Download
1 / 20
220 likes | 428 Views
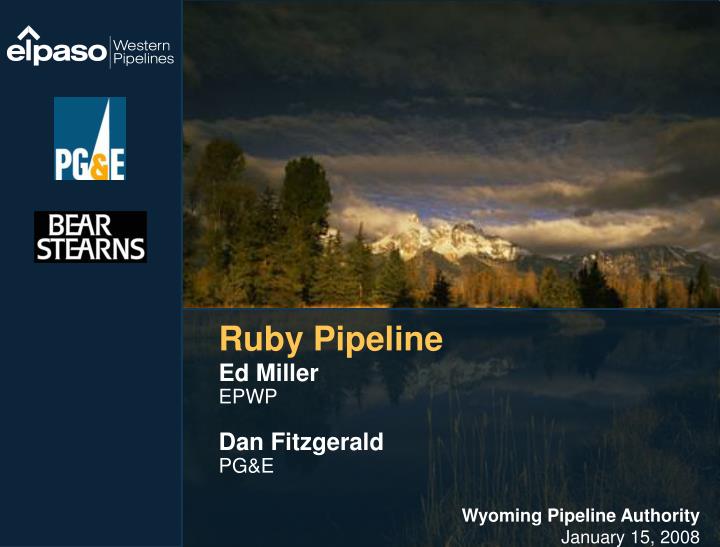
Ruby Pipeline. Ed Miller EPWP Dan Fitzgerald PG&E. Wyoming Pipeline Authority January 15, 2008. El Paso Corporation Overview.

E N D
Ruby Pipeline Ed Miller EPWP Dan Fitzgerald PG&E Wyoming Pipeline Authority January 15, 2008
El Paso Corporation Overview • El Paso Corporation provides natural gas and related energy products in a safe, efficient, dependable manner. We own North America’s largest natural gas pipeline system and are one of North America’s largest independent natural gas producers. We are organized around regulated and non-regulated businesses.
El Paso Pipeline System TennesseeGas Pipeline Wyoming Interstate ColoradoInterstate Gas Cheyenne Plains Pipeline MojavePipeline SouthernNatural Gas Elba IslandLNG El PasoNatural Gas Mexico Ventures Florida GasTransmission (50%) • 19% of total U.S. interstate pipeline mileage • 23 Bcf/d capacity (16% of total U.S.) • 16 Bcf/d throughput (28% of gas delivered to U.S. consumers) • Best market connection • Best supply access • Leading pipeline integrity program
Ruby Pipeline Map O R E G O N I D A H O GTN Malin Ruby Pipeline Opal to Malin W Y O M I N G PG&E CIG Opal Hub Tuscarora WIC C A L I F . Cheyenne Paiute Cheyenne Plains U T A H Uinta Basin N E V A D A Piceance Basin Kern River C O L O R A D O
Ruby Capacity and Facilities • Design and rates are based upon 1.2 Bcf/d of capacity • 680 miles from Opal to Malin • 42”, 1,440 psig pipe design • Most cost effective design taking fuel and expansion opportunities into consideration • Compressor stations • Opal ~45,400 HP (site rating) • Midpoint ~18,200 HP (site rating) • Fuel from Opal ~0.9% • Four delivery point interconnects and five receipt point interconnects • Expandable to 2 Bcf/d with compression
Ruby Highlights to Date • 1.2 Bcf/d pipeline from Opal to Malin • Ownership structure • El Paso Western Pipelines • PG&E Corporation • Bear Energy • During past 5 months, Ruby Project has been presented to most Rockies producers and some western markets under Confidentiality Agreements • Ruby filed an application with the BLM in November to construct a pipeline between Opal and Malin • Negotiations with pipe mills and contractors have been ongoing for over 6 months • Estimate has been finalized during this process • Approximately 50% of firm capacity has been committed • Ruby requires firm capacity commitments of 1.2 Bcf/d to be constructed
Rockies versus Western CanadaLong-Term Production Trends • Canadian Peak • 2001 Peak • - 17 Bcfd El Paso High Case Best fit of Current Trend: - 2033 Peak - 14 Bcfd Production El Paso Base Case Best Fit Curves Assumes: - Gaussian Curve - 320 EUR - Few environmental constraints El Paso Base case suggest 9,650 Bcfd of export capacity needed (currently 6,200 in 2007) to meet 85% LF requirement El Paso High case suggest 12,000 Bcfd of export capacity needed (currently 6,200 in 2007) to meet 85% LF requirement
Rocky Mountain Production by Basin (Volumes are Wellhead – Measured in MMcfd) 1990-2005: Wellhead total data from IHS database 2006: Estimate 2007-2015: El Paso forecast
Projected Gas Flowswith Ruby Bcf/d 5.75% fuel AECO Total Westbound pipeline capacity 2.6 Bcf/d Total Eastbound pipeline capacity 12 Bcf/d 3.28% fuel 4.8% to 5.3% fuel NE Chicago NWP Malin (GTN) 1.68% fuel 1.82% fuel 1.3% fuel ROX Ruby ROX Basis Improvement w/Ruby 2012: $0.50-$0.60 2015: $1.50 - $1.75 0.9% fuel NORTHERN CALIFORNIA 2.98% fuel Kern TC 1.3% fuel 2.87% fuel 1% fuel San Juan 2012 Northern CA Economic Dispatch 2.87% fuel Ruby gas will be first through the meter at Malin
Ruby Proposed Next Steps February-March Binding Open Season October 2008 State Regulatory Approvals Jan. 2008 Feb./Mar. 2008 April-Oct. 2008 May 2008 Transporter Board Approval January Ruby Packages Customer Follow-Up February El Paso Upstream Capacity Open Season April 2008 Shipper Board Approvals
Ruby Schedule Highlights Preliminary route work completed January FERC Prefiling March 2011 In-Service July-November Route Surveys and Mapping October Pipe Commitment July Commence Construction Filed route with BLM 2007 2008 2009 2010 2011 April Receive Certificate May Formal Customer Discussions Commence January File FERC Certificate Application March Pipe Option
U.S. West CoastDistinct Gas Markets Supplied primarily from two regions: 1. Western Canadian Sedimentary Basin 2. Western Domestic Basins (Rockies, San Juan and Permian) • Pacific Northwest 600 Bcf/yr • Northern California 835 Bcf/yr • Northern Nevada 65 Bcf/yr • Southern California 965 Bcf/yr
Natural Gas Storage Malin Takeaway BRITISH COLUMBIA Sumas WASHINGTON Northwest Pipeline • 2.2 Bcf/d firm takeaway capacity plus displacement on GTN at Malin • Access to west coast market: • Northern/Central California via Pacific Gas and Electric Company • Northern Nevada via Tuscarora Gas Transmission • Pacific Northwest via GTN and indirectly to Williams’ Northwest Pipeline and Avista Utilities • Southern California via deliveries off PG&E system • Access to 82 Bcf of underground storage • PG&E (CA): 42 Bcf • Wild Goose (CA): 24 Bcf * • Lodi (CA): 16 Bcf * Seattle Jackson Prairie Mist Portland GTN IDAHO OREGON Malin Ruby Tuscarora Gas Transmission CALIFORNIA PG&E Area of Detail NEVADA PG&E Wild Goose Line 400 Line 401 Pleasant Creek Lodi San Francisco Los Medanos McDonald Island Line 401 Line 300 * Currently being expanded Line 2
Northern/Central California Market2006 Demand • 2006 annual gas demand of 835 Bcf • Annual growth forecasted at 1.3% through 2025 • Results in incremental requirement of 67 Bcf of annual gas demand by 2012 • 2006 peak day demand was 3.5 Bcf (2007 peak day of 3.9 Bcf) • PG&E, Wild Goose and Lodi storage fields serve peak day demands • Two strong gas demand periods • Winter: Large residential demand • Summer: Large gas-fired generation load and storage injections 4.0 3.5 3.0 Bcf/day 2.5 2.0 1.5 Apr Feb Mar Jun Jan May Jul Aug Sep Oct Dec Nov Sources: 2006 California Gas Report and PG&E CGT Pipe Ranger
Jan Feb Mar Apr May Jun Jul Aug Sep Oct Nov Dec Northern Nevada Market2006 Demand • Annual gas demand of 64 Bcf • Annual growth forecasted at 4.0% through 2016 • Results in incremental requirement of 17 Bcf of annual gas demand by 2012 • Seasonal demand • 2006 Peak day demand was 0.32 Bcf • Lovelock LNG storage (1.0 Bcf) located near Reno, NV serve peak day demands • Ruby interconnects with both Paiute (near Lovelock) and Tuscarora (at Malin) 0.35 Seasonal Market with a Winter Peak 0.30 0.25 0.20 Bcf/day 0.15 0.10 0.05
Reno Pipelines in Northern Nevada • Northern Nevada is served via two pipelines (Tuscarora and Paiute) • Paiute Pipeline • Largest customers: SWG, Sierra Pacific • 96% of transport contracts • 155 MDth/d receipt capacity from NWPL • ~75 MMcf/d sources from Canadian supply • NWPL contracts expire by 2009 • System operates at an average load factor of 71% • Tuscarora Gas Transmission • Largest customers: Sierra Pacific, SWG, Barrick Gold • Represent 96% of transport • Certificate issued 7/24/07 for an expansion of 40 MDth/d that will serve the Tracy Power Plant (514 MW) • 22.5-year contract with Sierra Pacific Power (40 MDth) upstream of Malin • SWG and Barrick do not hold capacity on upstream pipe Northwest Pipeline GTN IDAHO OREGON Malin RUBY PG&E 0.17 Bcf/d Tuscarora UTAH 0.2 Bcf/d Paiute CALIFORNIA NEVADA
Seattle s s Jan Feb Mar Apr May Jun Jul Aug Sep Oct Nov Dec Pacific Northwest (PNW) Market2006 Demand Sumas BRITISH COLUMBIA Kingsgate WASHINGTON Northwest Pipeline 3.5 • Annual gas demand of 600 Bcf • Annual growth forecasted at 2.1% through 2012 • Results in incremental requirement of 80 Bcf of annual gas demand by 2012 • 2006 peak day demand was 2.9 Bcf • Jackson Prairie, MIST and Clay Basin storage fields serve peak day demands • Gas-fired power generation load varies depending on hydro power availability • Demand is more seasonal 3.0 Jackson Prairie 2.5 MIST IDAHO Portland NWN GTN 2.0 Bcf/day OREGON 1.5 1.0 Malin 0.5 NEVADA Sources: Northwest Gas Association 2006 Outlook and Northwest Pipeline and GTN Scheduled Volumes
Ed Miller Business Development 719.520.4305 Edward.Miller@elpaso.com Roland Harris Business Development 719.520.4380 Roland.Harris@elpaso.com Russ Council Engineering 719.520.4865 Russ.Council@elpaso.com Jennifer Webster Government Affairs 719.520.4327 Jennifer.Webster@elpaso.com Dan Fitzgerald 415.267.7041 Daniel.Fitzgerald@pcgpipeline.com Jeff Rawls 713.236.3380 JRawls@bear.com Contacts El Paso Western Pipelines PG&E Bear Energy
Ruby Pipeline Ed Miller EPWP Dan Fitzgerald PG&E Wyoming Pipeline Authority January 15, 2008