Download
1 / 29
290 likes | 391 Views
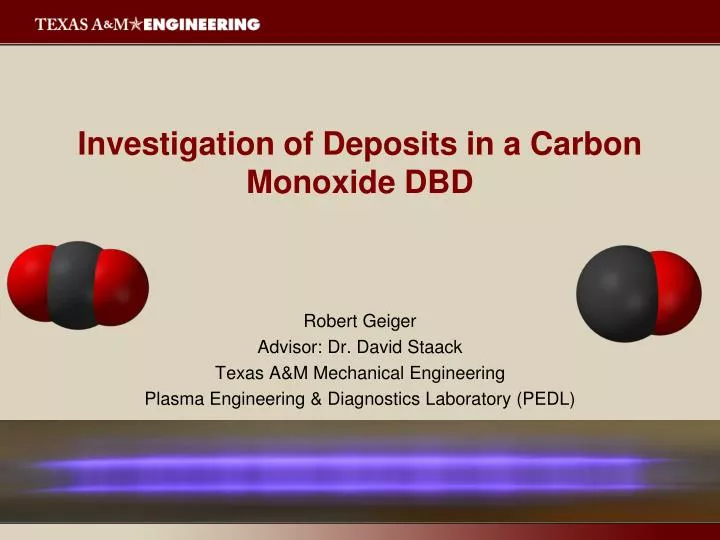
Investigation of Deposits in a Carbon Monoxide DBD. Robert Geiger Advisor: Dr. David Staack Texas A&M Mechanical Engineering Plasma Engineering & Diagnostics Laboratory (PEDL). Outline. Introduction Experimental Setup Results Future Work Conclusion. Introduction.

E N D
Investigation of Deposits in a Carbon Monoxide DBD Robert Geiger Advisor: Dr. David Staack Texas A&M Mechanical Engineering Plasma Engineering & Diagnostics Laboratory (PEDL)
Outline • Introduction • Experimental Setup • Results • Future Work • Conclusion
Hydrocarbon Utilization CO2 CH4 (CxHy) H=393.5 kJ/mol CO2 H=241 kJ/mol H2O H2O H=110 kJ/mol CO2 CO H2 • Combustion • Fischer Troscph • Ethanol • Hydrogen • CO Polymer ?
Molecular Forms of C and O ? • CO • CO2 • C3O2 Carbon Suboxide (Matthias Ballauff, et. al Angew. Chem. Int. Ed. 2004, 43)
Carbon Monoxide at Really High Pressures V V Brazhkin 2006 J. Phys.: Condens. Matter 18 9643 Lipp M J et al 2005 Nat. Mater.4 211
Experimental Setup • Power Supply: • Vmax ~ 10 kV • Imax ~ 40 mA • Freq ~ 25 – 30 kHz • P ~ 40W-150W
DBD Reactor Color Variations
Increasing Flow 870 ccm 1700 ccm 180 ccm Increasing Power ~ 30W ~50W ~100W Also, gas temperature and surface temperature do not cause the different film colors.
FTIR – Comparison with High Pressure Film (High Pressure Film FTIR data taken from: Lipp M J et al 2005 Nat. Mater. 4 211)
Film Properties Hydration • C:O ~ 1.5 - 3.5 (XPS) • Solubility • Water (Hydrates) • Insoluble • Acetone • Ethanol • Solubility allows for spin coating and layer by layer film growth Before After C:O ~ 1.9 1.7
Kinetics Proposed mechanism from several sources McTaggart FK PIasma Chemistry in Electrical Discharges (1967)
Kinetic Model in Development Still need to add • CO* reactions • C(s) reactions • Surface reactions
Kinetic Model in Development • Const T • Te = 1 eV • ne = 1013 cm-3 • ne = const CO C3O2 CO2 C3O2(p)
Emission Spectroscopy Herzberg CO Bands (C1Σ+ – A1π) Angstrom CO Bands (B1Σ+ – A1π) C2 Swan Bands (d3π– a3π)
Future Work • Determine the polymer structures (NMR) and chain length • Characterize polymers and determine their properties • Complete the kinetic model and compare with experimental • Determine optimum production parameters
Conclusion • Interesting films can be formed as fast as 1 mg/min at 50W with solely carbon and oxygen atoms • These films appear similar in structure to high pressure CO polymers • Increased power darkens the film and increases deposition rate • Color changes do not alter the FTIR • A kinetic model in under development • The C2 swan, CO angstrom and CO Herzberg bands enables temperature measurements in the visible range
References • Lipp M J et al 2005 Nat. Mater.4 211 • V V Brazhkin 2006 J. Phys.: Condens. Matter 18 9643 • McTaggart FK PIasma Chemistry in Electrical Discharges (1967) • P.C.Cosby, J. Chem. Phys. 98,9560(1993). • K.M.D’Amico,and A.L.S.Smith, J.Phys.D: Appl. Phys. 10,261 (1977) Questions? Email: rpg32@tamu.edu
Solubility and Hydration Before After
Metastability of CO CO CO2 + C(gr)
FTIR – Comparison with High Pressure Film (High Pressure Film FTIR data taken from: Lipp M J et al 2005 Nat. Mater. 4 211)
XPS • C/O ratios ranging from 1.5-3.5 Ref: INSERT REF
Color Changes with Time and Power Low Power Setting (~60W) 30 min 60 min 120min 180min Hi Power Setting (~130W, 180 min) Low Power Setting (~60W, 180 min)