Download
1 / 29
290 likes | 468 Views
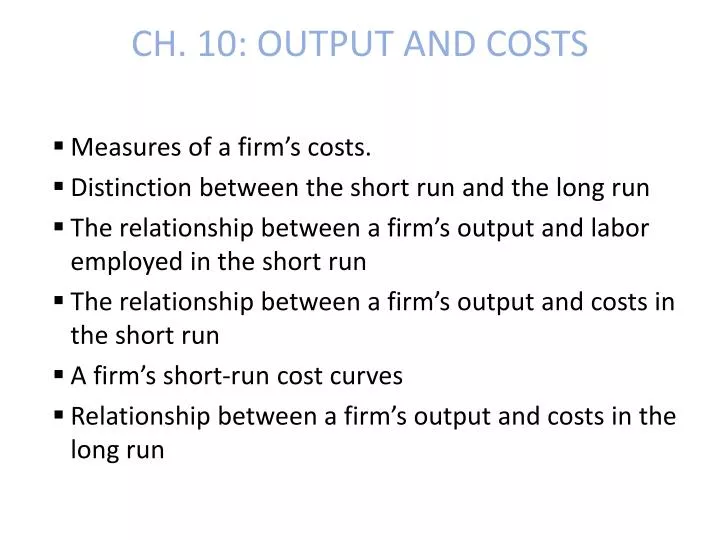
CH. 10: OUTPUT AND COSTS. Measures of a firm’s costs. Distinction between the short run and the long run The relationship between a firm’s output and labor employed in the short run The relationship between a firm’s output and costs in the short run A firm’s short-run cost curves

E N D
CH. 10: OUTPUT AND COSTS • Measures of a firm’s costs. • Distinction between the short run and the long run • The relationship between a firm’s output and labor employed in the short run • The relationship between a firm’s output and costs in the short run • A firm’s short-run cost curves • Relationship between a firm’s output and costs in the long run
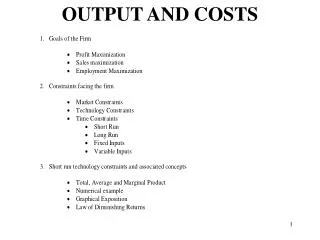
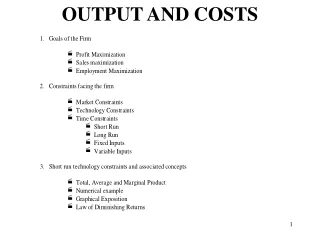
Decision Time Frames • The Short Run • A time frame in which one or more resources used in production is fixed. • For most firms, capital is fixed in the short run. • Other resources used by the firm (such as labor, raw materials, and energy) are variable in the short run. • Short-run decisions are easily reversed. • The Long Run • A time frame in which the quantities of all resources —including capital — can be varied. • No fixed inputs in the long run.
Decision Time Frames • Sunk Costs. • A cost incurred by the firm that cannot be changed. • If a firm’s plant has no resale value, the amount paid for it is a sunk cost. • Sunk costs are irrelevant to a firm’s decisions . • Examples: • The price that a landlord paid for a piece of property should have no effect on rent charged. • The price that an airline paid for jets that it purchased previously should have no effect on the price they charge for airline tickets today.
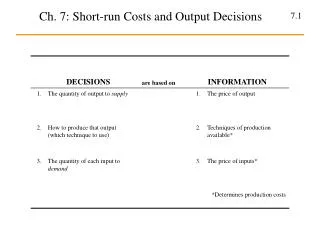
SR Measures of Production • Total product (TP) • Units of output produced in a given period. • Marginal product of labor (MPL) • D TP resulting from one additional unit of L, ceteris paribus. • DTP/DL • Average product of labor (APL) • TP/L
Relationship between TP, MP and AP • The Total Product Curve
Relationship between TP, MP and AP • The Total Product Curve
Relationship between TP, MP and AP Almost all production processes are like the one shown here and have: • Initially increasing marginal returns • Eventually diminishing marginal returns
Relationship between TP, MP and AP • Increasing marginal returns • MP rises as use of input increases • Results from increased specialization and division of labor. • Diminishing marginal returns • MP falls as use of input increases • Occurs because amount of capital per worker falls. • The law of diminishing returns • As a firm uses more of a variable input with a given quantity of fixed inputs, the marginal product of the variable input eventuallydiminishes.
Short-Run Technology Constraint • IF MP>AP, what happens to AP if L is increased? • If MP<AP, what happens to AP if L is increased? • MP=AP when AP is at a maximum.
Suppose that a firm has 10 workers producing tables, APL is 5 and MPL of the 11th worker is 4. What is TP with 10 workers?
Suppose that a firm has 10 workers producing tables, APL is 5 and MPL of the 11th worker is 4. What is TP with 11 workers?
Suppose that a firm has 10 workers producing tables, APL is 5 and MPL of the 11th worker is 4. If the 11th worker is added, we know that: • APL will decrease. • APL will increase. • MPL will increase.
SR Cost • Total cost(TC) is the cost of all resources used. • Total fixed cost(TFC) is the cost of the firm’s fixed inputs. Fixed costs do not change with output. • Total variable cost(TVC) is the cost of the firm’s variable inputs. Variable costs do change with output. TC = TFC + TVC
SR Costs • Marginal Cost • the increase in total cost that results from a one-unit increase in total product. • DTC/DTP • If labor is the only variable input, MC=W/ MPL • Over the output range with increasing marginal returns, marginal cost falls as output increases. • Over the output range with diminishing marginal returns, marginal cost rises as output increases.
SR Costs • Average Costs • Average fixed cost(AFC) = TFC/TP • Average variable cost(AVC) = TVC/TP • If labor is the only variable input, AVC=W/APL • Average total cost(ATC) is total cost per unit of output. ATC = TC/TP = AFC + AVC.
SR Costs • Marginal vs. AVC and ATC • If MC<AVC, AVC decreases as TP increases • If MC>AVC, AVC increases as TP increases • If MC<ATC, ATC decreases as TP increases • If MC>ATC, ATC increases as TP increases
SR Cost Curves • The ATC curve is U-shaped. • If MC<AVC, AVC is falling. • If MC>AVC, AVC is rising. • MC always interesects • ATC at min of ATC • AVC at min of AVC • AFC always decreases as output increases .
Short-Run Cost • Shifts in Cost Curves • The position of a firm’s cost curves depend on two factors: • Technology • Prices of productive resources • What is effect on ATC, MC, AVC of • Increase in price of labor. • Increase in fixed costs • Increase in productivity of labor.
Long-Run Cost • In the long run, all inputs are variable and all costs are variable. • The Production Function • Shows the relationship between the maximum output attainable and the quantities of both capital and labor.
Long-Run Cost • Marginal product of capital (MPk) • the increase in TP from one more unit of capital, ceteris paribus. • A firm’s production function exhibits diminishing marginal returns to labor as well as diminishing marginal returns to capital (for a given quantity of labor). • For each plant size, diminishing marginal product of labor creates a set of short run, U-shaped costs curves for MC, AVC, and ATC.
LR Cost The long-run average cost curve is the relationship between the lowest attainable average total cost and output when both the plant size and labor are varied. K=2 K=1 K=3 K=4 What’s the low cost method for producing 5 sweaters? 13 sweaters? 25 sweaters?
LR Cost The long-run average cost (LRAC) curve.
LR Cost • Economies of scale • falling long-run average cost as output increases. • Diseconomies of scale • rising long-run average cost as output increases. • Constant returns to scale • constant long-run average cost as output increases.
Long-Run Cost • Minimum efficient scale is the smallest quantity of output at which the long-run average cost reaches its lowest level. LRATC MES
Market Structure and Minimum Efficient Scale • As MES rises relative to consumer demand, the number of firms in the industry will fall. • Cases to consider: • Microsoft • Steel industry • Printing industry • Farming