Download
1 / 16
160 likes | 300 Views
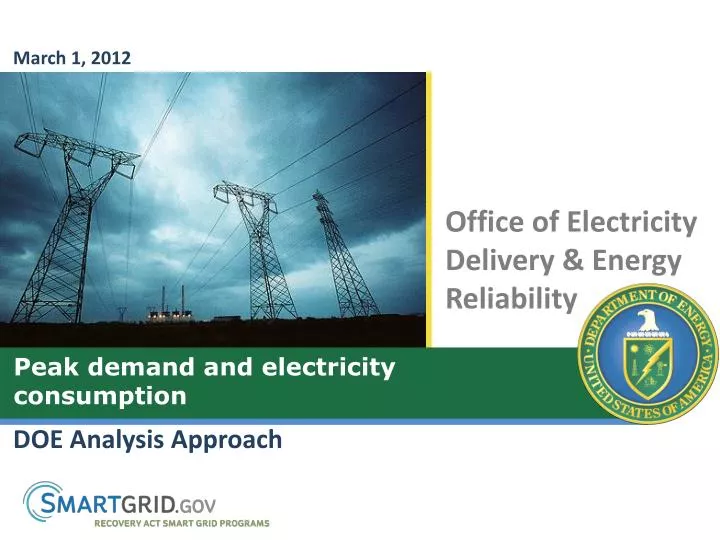
March 1, 2012. Office of Electricity Delivery & Energy Reliability. Peak demand and electricity consumption. DOE Analysis Approach. Introduction.

E N D
March 1, 2012 Office of Electricity Delivery & Energy Reliability • Peak demand and electricity consumption • DOE Analysis Approach
Introduction Build and impact metric data provided by the SGIG recipients convey the type and extent of technology deployment, as well as its effect on grid operations and system efficiency. Metrics and Benefits Plan 2013 2015 Build Metric Reporting and Analysis Impact Metric Reporting and Analysis
Six Primary Analysis Focus Areas There are six areas where the analysis is focused. This presentation addresses analysis efforts associated with peak demand and electricity consumption. • Peak Demand and Electricity Consumption • Advanced Metering Infrastructure • Pricing Programs and Customer Devices • Direct Load Control • Operations and Maintenance Savings from Advanced Metering • Meter Reading • Service changes • Outage management • Distribution System Reliability • Feeder switching • Monitoring and health sensors • Energy Efficiency in Distribution Systems • Voltage optimization • Conservation voltage reduction • Line losses • Operations and Maintenance Savings from Distribution Automation • Automated and remote operations • Operational Efficiency • Transmission System Operations and Reliability • Application of synchrophasor technology for wide area monitoring, visualization and control
DOE/Recipient Dialogue • DOE would like to establish a dialogue with recipients to explore peak demand the electricity consumption impacts associated with the application of AMI, pricing programs and customer systems. The outcome is to share this information across the industry. DOE’s Interests Recipients’ Interests • Analysis Approach: Working through issues relating to measuring impacts • Analytical methodology • Baseline/control groups • Underlying factors leading to results • How to convey the results and to whom? • Lessons-Learned/Best-Practices: Internally and externally conveyed • What can we learn from each other? • How do we want to document lessons-learned and best practices for external communication? • Are there detailed case studies that can be developed? • What would you like to address in a group setting? • What do you want to learn or share? • How would you like to exchange information? • In smaller or more focused groups? • How should we structure and support the discussion? • Are there issues you are NOT interested in addressing here?
DOE’s Analysis Objectives • This focus area will examine the changes in peak demand, electricity conservation, and shifting of usage that results from the application of smart meters, pricing programs, pricing information and customer devices. Analysis Objectives • Evaluate the influence of smart meters, pricing information, customer devices such as programmable controllable thermostats, in-home displays, and direct load control devices on: • Change in peak demand • Peak shift • Electricity conservation • Quantify how changes in electricity usage patterns and pricing affect consumer electricity bills, fuel mix for electricity generation, and power plant emissions.
SGIG Projects • SGIG projects deploying AMI include a broad mix of IOUs, municipal and cooperative utilities. SGIG Projects Implementing AMI Source: SGIG Build metrics and Navigant analysis
Technologies • Project teams are deploying a variety of different technologies. • Backhaul and Head end server • Collects customer meter data and transmits it to a central information center • Options include broadband, cellular, wireless, and Ethernet networks • Enables utilities to manage dispersed data collection • Smart meter • Provides foundation for two-way communications between utilities and customers • Enables utilities to offer information, tools, and incentives for customers to reduce and shift electricity usage • Field area network • Displays and communicates energy usage information to customers • Interoperates with appliances, lighting, and HVAC based on grid conditions and time based rate • Other • Activities related to planning and supporting AMI deployment • Includes planning, engineering costs, consulting, management, and security
Peak Load Reduction Approaches • DOE has seen three general applications within projects that are conducting smart grid projects related to peak demand and electricity consumption. Time based rate program Offering electricity rates ($/kWh) that vary by time of day or year, such as a critical peak pricing program, might cause customers to change electricity consumption. Customers enter an agreement with a utility to reduce demand by controlling selected appliances, such as air conditioners and pool pumps, during peak demand periods. Direct load control equipment can be supported by AMI communications infrastructure. Direct load control program Customers gain information about and control over electricity consumption. For example, web portals provide insight into electricity consumption and programmable controllable thermostats offer control over electricity consumption. Customer systems
Build and Impact Metrics • Build and Impact metrics will track the deployment of technology and how it affects peak demand and electricity consumption. Key Build Metrics (Technologies) Key Impact Metrics • Smart meters • Communications system • Customer EMS/Display/Portal • Time-based rate programs • Direct load control devices • Hourly customer electricity usage • Monthly customer electricity usage • Peak load and mix (direct load control) • Peak generation or supply and mix (generation fuel and technology) • Annual electricity production or supply • Annual electricity production cost • Ancillary services cost • CO2, SO2, NOX, and PM emissions, generation or supply
Logic for Analyzing Peak Demand Change Impact • Analyzing hourly and monthly electricity usage provides insight into peak demand changes, peak demand shifts, and overall electricity usage changes. Peak demand change Magnitude of peak demand change Hourly electricity usage Hourly electricity usage Peak demand shift Occurrence and magnitude of shift Monthly electricity usage Change in electricity consumption Magnitude and direction of electricity usage change Hourly electricity usage Change in Impact Metric Analysis Benefit Electricity usage data should be collected for representative customer classes.
Impact of Technology Configuration • DOE will also work with projects to examine affect of technology configuration on peak demand, peak shift, and electricity consumption. Change in peak demand Magnitude of peak demand change (kW) Hourly electricity usage Analyze technology configuration impact Monthly electricity usage Peak shift Occurrence and magnitude of shift (kWh) Peak load and mix (direct load control) Change in electricity consumption Magnitude and direction of electricity usage change (kWh) Change in Impact Metric Analysis Benefit
Electricity usage (kWh) variables • Electricity usage (kWh) variable names used in calculations P (Real Power Delivered) is the raw electricity usage data reported by recipients. P represents the mean electricity usage for the treatment or control group for a specified period.
Peak Demand Reduction • Change in peak demand can be calculated with hourly electricity usage data. Some projects are reporting time of peak hours with their hourly electricity usage data. If they are not reporting the peak, we can determine peak hours by finding hours of maximum demand. The change in peak demand is calculated for peak hours: Magnitude of peak demand change Example: Electricity usage for a July week with a peak pricing program We calculate the difference between hourly electricity usage at the peak to determine change in peak demand ΔPPeak
Peak Shift • Peak demand shift can be detected and calculated from hourly electricity usage data. • Peak shift is determined by: • Calculate change in electricity usage ΔPi per each hour i: • For each hour where ΔPi ≠ 0, a change in electricity consumption occurred. We anticipate ΔPi ≤ 0 at peak hours and ΔPi ≥ 0 at off-peak hours when a shift occurs. Occurrence and magnitude of shift Example: Electricity usage for a July day with a peak pricing program In peak shifting ,we expect change in hourly electricity usage at peak hours to be less than 0 because treatment should be smaller than control: ΔPi ≤ 0 In peak shifting ,we expect change in hourly electricity usage at off-peak hours to be greater than 0 because treatment should be greater than control: ΔPi ≥ 0
Electricity Conservation • Change in overall electricity consumption can be calculated from hourly or monthly electricity usage data. Example: Hourly electricity usage from May – August with a summer peak pricing program Magnitude and direction of electricity usage change If a recipient reports hourly data for the 4 month period, we calculate total change: Example: Monthly electricity usage from April – September with a summer peak pricing program (MWh) Alternatively, if a recipient reports monthly data for the 4 month period, we calculate total change:
Additional Analytical Questions • What other kinds of impacts are project teams expecting, and how should we be looking for them in the metrics data? • What other kinds of data or information can be shared to help the group understand impact? • How are utilities operating the AMI, time based pricing programs, direct load control programs, and customer systems, and how can that shared? • How are baselines and customer control groups being established? • How might service area and technology configuration affect results? • What kinds of “experiments” can the forum projects perform together?