Download
1 / 45
450 likes | 626 Views
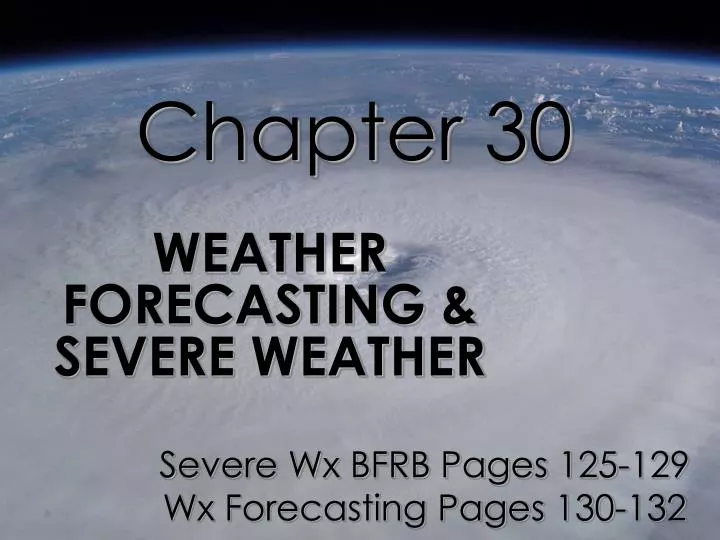
Chapter 30. WEATHER FORECASTING & SEVERE WEATHER. Severe Wx BFRB Pages 125-129 Wx Forecasting Pages 130-132. FORECASTING. Station Models. Used on weather maps to show the current weather conditions for a particular location They are easy to read and understand ESRT’S Page 13 Bottom.

E N D
Chapter 30 WEATHER FORECASTING & SEVERE WEATHER Severe Wx BFRB Pages 125-129 Wx Forecasting Pages 130-132
Station Models • Used on weather maps to show the current weather conditions for a particular location • They are easy to read and understand • ESRT’S Page 13 Bottom
The circle at the center shows the amount of cloud cover • The “flag pole” coming out of the circle shows the direction that the wind is coming from • Each “flag” shows approximate wind speed. A half flag shows an approx. 5 knot wind, and a whole flag shows an approx. 10 knot wind • *Add up the amount for all of the flags to get the total wind speed
Air pressure is shown by using the last 3 digits of the pressure in millibars (coded) • Ex. 1018.6mb = 186 on the station model • To determine the air pressure from the numbers on the station model, use the following rule: (aka to decode) • If the first number is 5 or less, put a 10 in front of it • If the first number is 6 or higher, put a 9 in front of it • Put the decimal point between the last two numbers
Ex. 892 for air pressure on the station model • The first number (8) is greater than 5, so I will put a 9 in front of it (becomes 9892) • Then I put the decimal between the last two numbers (becomes 989.2mb) • The correct air pressure is 989.2mb from the number 892 on the station model • **Remember, surface air pressure is usually between 960mb – 1050mb • If your answer is not in this range, then it is wrong. Check your work!
Encode this weather data: Cross River – Cloudy, 61°F, 58° DP, 8.0 mile visibility, 30.35 inches falling, wind speed 9 mph, from SW. 61 280 8 \ 58 0
Decode this Station Model!!! 88 862 ¼ -11\ 86 .35
Thunderstorms • small area storms formed by the strong upwardmovement of warm, moist air • usually occurs ahead of a cold front as the colder, denser air shoves the warmer air upward • This forms the cumulonimbus clouds that produce thunderstorms • These storms are accompanied by heavy rain, thunder, lightning, sometimes hail, and can also produce tornadoes
All thunderstorms produce lightning • Lightning is the discharge of huge amounts of static electricity (think of walking across a carpet in your socks and then touching something-ZAP) • Lightning can travel from the cloud to the ground, cloud to cloud, or even from the ground to a cloud! • Thunder is the result of the air quickly expanding from the heat of the lightning bolt (causes a sound wave) • You cannot have lightning without thunder and vise versa!!
Supercell Thunderstorm formations – will form SEVERE storms and tornadoes! THIS IS ONE BIG STORM SYSTEM!
Tornadoes • Form from very powerful thunderstorms (cumulonimbus clouds) • These are funnel shaped columns of spiraling winds that extend down to the ground from the base of a cloud • The winds move into a tornado (low pressure), and can reach a maximum of 318 mph! • The actual funnel is made by water droplets (clouds) and dust
Tornadoes are especially dangerous because it is so difficult to predict where they will form • Damage is usually along a narrow path where the tornado traveled • They usually last less than one hour • Most fatalities are caused by flying debris • Tornadoes are rated on the Fujita scale (F0 – F6) • An F6 is very rare, and can have wind speeds up to 318 mph
Tornadoes will pick up dust and debris from the ground when they “touch down” – this creates a wider swirl at the bottom of the tornado
Hurricanes • Huge tropical low pressure systems that get their energy from the tremendous amount of warm ocean water that is evaporated and condenses inside the storm • Hurricanes MUST form over open warm ocean water (WARM WATER = FUEL) • VIF - Since this is where it gets its energy from, hurricanes weaken as they pass over land or colder water
Since hurricanes are extreme low pressure storms, the winds blow into the storm, and it spins counter-clockwise (to the left) • The lowest air pressures on Earth have been recorded inside the eye of hurricanes • Hurricanes are associated with very high winds and heavy rains • Storm surge is the term used for the water that a hurricane blows onto the shore, causing severe flooding • Spring Tides = more severe flooding • Neap Tides = less severe flooding
Most fatalities are caused by drowning in the storm surge (many foolish people do not evacuate areas when told to do so)!! • A “tropical storm” is designated a “hurricane” when its winds reach 74 mph and vice versa. • Hurricanes are classified as Category 1 – Category 5 (strongest) • All hurricanes are named in each ocean in alphabetical order, alternating male and female names • Pacific, Atlantic and Indian Oceans all have their own names for their Hurricane Seasons!!!
Airforce Meteo planes fly through Eyewalls of Hurricanes to collect data to help meteorologists determine where a Hurricane will travel to
Hurricane damage can range from broken windows to complete demolition of buildings. Until Katrina, Andrew was the costliest hurricane to date for the USA with a price tag of over $20 BILLION! Katrina is now estimated to have a $200 BILLION price tag!!!