Download
1 / 8
80 likes | 88 Views
Learn how to model exponential and logarithmic functions to predict population size and growth rate using real-life examples.

E N D
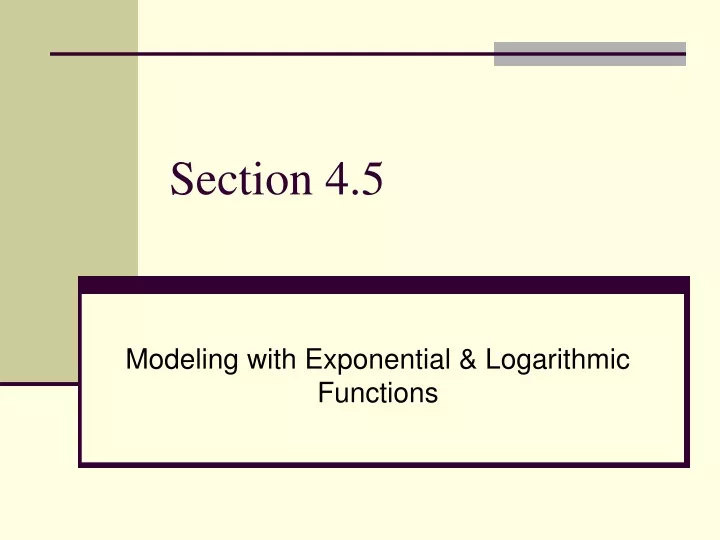
Section 4.5 Modeling with Exponential & Logarithmic Functions
Derivation of model • Let’s say we have a population of 1000 bacteria that doubles in size every 3 hours. • LetA(t) represent the number of bacteria we have after t hours. Then: A(0) = 1000 A(3) = 1000 ∙ 2 A(6) = (1000 ∙ 2)∙ 2 = 1000 ∙ 22 A(9) = (1000 ∙ 22) ∙ 2 = 1000 ∙ 23 A(12) = (1000 ∙ 23) ∙ 2 = 1000 ∙ 24 So, we get this pattern: A(t) = 1000 ∙ 2t/3 In general, A(t) = A0ert
y y increasing y = A0ert r > 0 y = A0ert r < 0 A0 x x Exponential Growth and Decay Model • The mathematical model for exponential growth or decay is given by • A(t) = A0ert • If r > 0, the function models the amount or size of a growing entity. • If r < 0, the function models the amount or size of a decaying entity. • A(t) is the amount at time t • A0 is the original amount (or amount at time t = 0) • r represents the relative rate of growth (or decay). decreasing A0
Example 1: Predicting Population Size The initial bacterium count in a culture is 500. A biologist later makes a sample count of bacteria and finds that the relative growth rate is 40% per hour. • Find the exponential growth function that models the number of bacteria after t hours. • How much bacteria will there be after 10 hours? Solution: a)Use A(t) = A0ert with A0 = 500 and r = 0.4 : A(t) = 500e0.4t(t is in hours) b) Using answer from (a), the bacteria count after 10 hours (t = 10) is: A(10) = 500e0.4(10) = 500e4 ≈ 27,300
30 25 20 15 Population (millions) 10 5 1970 1980 1990 2000 Year Example 2: Modeling Mexico City’s Growth The graph below shows the growth of the Mexico City metropolitan area from 1970 through 2000. In 1970, the population of Mexico City was 9.4 million. By 1990, it had grown to 20.2 million. • Find the exponential growth function that models this data. • When will the population reach 40 million?
Isolate the exponential by dividing both sides by 9.4 Solution a) Use A(t) = A0ert where t is the number of years since 1970. (So, 1970 corresponds to t = 0.) At that time there were 9.4 million people, so we substitute 9.4 for A0 into the formula: A(t) = 9.4 ert There were 20.2 million people in 1990. Since 1990 is 20 years after 1970, this means when t = 20 the value of A(20) is 20.2. Subbing these numbers into the formula gives: 20.2 = 9.4 er•20When t = 20, A(t) = 20.2.
Isolate the exponential by dividing both sides by 9.4. Rewrite into logarithmic form. Divide both sides by 20 and solve for r. Solution (cont’d) Substitute 0.038 for r into the formula to get: A(t) = 9.4 e0.038t (t is measured in years since 1970)
Divide both sides by 9.4 Rewrite in logarithmic form. Solve for t by dividing both sides by 0.038. Solution (cont’d) b) To find the year in which the population will grow to 40 million, we substitute 40 in for A(t) in the model from part (a) and solve for t. A(t) = 9.4 e0.038tThis is the model from part (a). 40 = 9.4 e0.038t Substitute 40 for A(t). Since 38 is the number of years since 1970, this means that the population of Mexico City will reach 40 million by 2008.