Download
1 / 57
570 likes | 680 Views
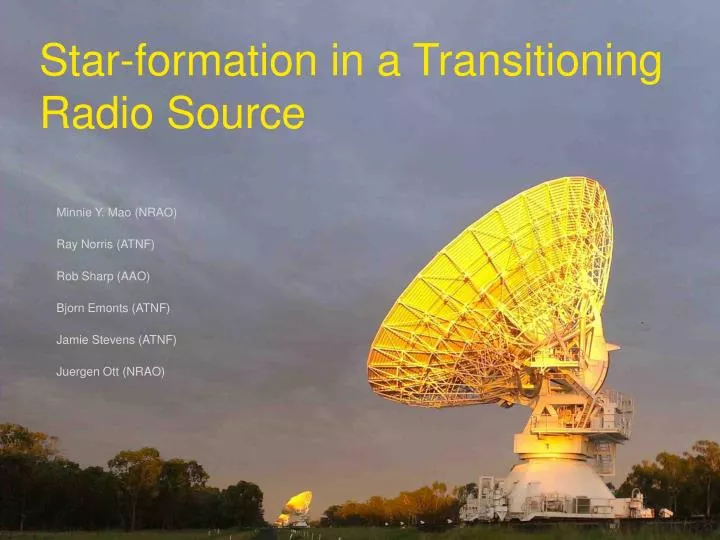
Star-formation in a Transitioning Radio Source. Minnie Y. Mao (NRAO) Ray Norris (ATNF) Rob Sharp (AAO) Bjorn Emonts (ATNF) Jamie Stevens (ATNF) Juergen Ott (NRAO).

E N D
Star-formation in a Transitioning Radio Source Minnie Y. Mao (NRAO) Ray Norris (ATNF) Rob Sharp (AAO) Bjorn Emonts (ATNF) Jamie Stevens (ATNF) JuergenOtt (NRAO)
F00183-7111 is a Ultra-Luminous Infrared Galaxy that has a big AGN in its core that appears to be dominating the total infrared luminosity, which is surprising as ULIRGs are classically thought to be dominated by star-formation … Minnie Y. Mao (NRAO) Ray Norris (ATNF) Rob Sharp (AAO) Bjorn Emonts (ATNF) Jamie Stevens (ATNF) Juergen Ott (NRAO)
F00183-7111 is so awesome! Minnie Y. Mao (NRAO) Ray Norris (ATNF) Rob Sharp (AAO) Bjorn Emonts (ATNF) Jamie Stevens (ATNF) Juergen Ott (NRAO)
Why this is interesting IRAS F00183-7111 is one of the most extreme Ultra Luminous Luminous Infrared Galaxies (ULIRGs) known ULIRGs are believed to represent a transitional stage towards the formation of dusty quasars (e.g. Armus, Heckman & Miley 1987) Understanding the nature of ULIRGs is thus critical to understanding the evolution of galaxies Especially when they’re relatively close like F00183… (z = 0.3276) F00183 appears to have been caught just as it’s transitioning to quasar-mode (Norris et al. 2012) Debates have raged over whether ULIRGs are predominately powered by star-formation (e.g. Genzel et al. 1998) or AGN (e.g. Sanders 1999) Let’s find out…
It helped that the source is dec = -71 degrees so I had to go home for the observations…
ULIRG: What’s in a name?A nose by any other name would still smell… – Reduced Shakespeare Company Ultra Very; extremely Luminous Full of or shedding light; bright or shining, esp. in the dark Infrared Having a wavelength just greater than that of the red end of the visible light spectrum but less than that of microwaves. Infrared radiation has a wavelength from about 800 nm to 1 mm, and is emitted particularly by heated objects Galaxy A system of millions or billions of stars, together with gas and dust, held together by gravitational attraction
ULIRG: What’s in a name?A nose by any other name would still smell… – Reduced Shakespeare Company A system of millions or billions of stars, together with gas and dust, held together by gravitational attractionthat is extremely full of or shedding light that has a wavelength just greater than that of the red end of the visible light spectrum but less than that of microwaves… IR emission dusty! – hot dust may be attributed to the UV emission from young hot OB stars, which is being absorbed by the dust and reradiated… ULIRGs are galaxies that are extremely star-bursty?
ULIRGs Ultra Luminous InfraRed Galaxies Extremely Luminous FIR sources (ELFs) Classically defined as LIR > 1012L ULIRGs were first discovered by IRAS almost 30 years ago (Aaronson & Olszewski 1984) ULIRGs are believed to be predominately powered by star-formation, but may have a significant contribution by AGN (e.g. Lonsdale 2006) The closest ULIRG to us is Arp 220 (z = 0.018)
ULIRGs Current observations suggest that ULIRGs are formed as a result of the merger of two gas-rich spirals (Sanders et al. 1988) The merger scenario for ULIRGs triggers “cold-mode” accretion onto the central black hole The dusty, gas-rich spiral galaxies feed the black hole resulting in its rapid growth This leads to powerful quasar winds that quench star-formation (e.g. Hopkins et al. 2008), which drives the black hole’s fuel away thus starving both the AGN and the star-formation The AGN now accretes hot gas inefficiently resulting in “hot-mode” accretion
ULIRGs Image credit: CANDELS • ULIRGs are believed to be an evolutionary stage of the classic double-lobed radio galaxies we see in the local Universe!
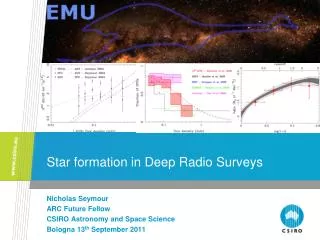
IRAS F00183-7111 F00183 is one of the most luminous sources discovered by IRAS! z = 0.3276 (Roy & Norris 1997) S70μm = 1.5 Jy L8-1000μm = 9 x 10¹² L (Spoon et al. 2009) L4.8GHz = 3 x 1025 W/Hz (Roy & Norris 1997) Radio-loud ULIRG!
IRAS F00183-7111 Image: Figure 1 from Norris et al. 2012. Naturally weighted 2.3 GHz LBA image of F00183. The peak flux is 45 mJy/beam and the source has a total integrated flux of 178 mJy. One of the best ways of distinguishing between star-formation and AGN is the use of VLBI. Recently, Norris et al (2012) detected F00183 at 2.3 GHz using the LBA The LBA image displays a classical core-jet morphology The morphology and spectral index are both consistent with Compact Steep Spectrum (CSS) sources (O’Dea 1998) CSS sources are widely thought to represent an early stage of evolution of radio galaxies (e.g. Randall et al. 2011)
IRAS F00183-7111 Image: Figure 3 from Norris et al. 2012. UKST R-band image of F00183. The green contours show the location of the LBA detection F00183 is believed to have been caught in the brief transition period between merging starburst and radio-loud “quasar-mode” accretion (Norris et al. 2012)
A quasar has turned on! But it’s a ULIRG so let’s look for the star-formation…
CO(1-0) Molecular hydrogen (H2) is a key ingredient to forming stars However, unless shocked or heated to very high temperatures, H2 is very difficult to see due to its strongly forbidden rotational transitions H2 may be traced by carbon monoxide (CO), which emits strong rotational transition lines that occur primarily through collisions with H2. CO traces the star-formation and is NOT contaminated by the presence of AGN At z = 0.3276, CO(1-0) is redshifted into the 3mm observing band on the Australia Telescope Compact Array.
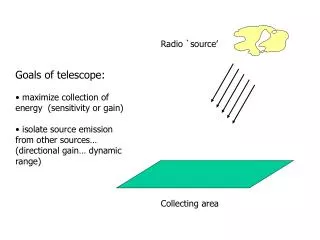
ATCA Australia TelescopeCompact Array Located in Narrabri, NSW (~6h drive from Sydney) 6 x 22m antennas 6km maximum baseline Operates from 1GHz to 106GHz in 5 discrete bands (~3mm – 30cm) In 2009, ATCA was upgraded with the Compact Array Broadband Backend (CABB) Operated by the CSIRO Astronomy and Space Science (CASS) division and is part of the Australia Telescope National Facility (ATNF)
CABB Compact Array Broadband Backend Wilson et al. (2011) Pre-CABB instantaneous bandwidth: 2 x 128MHz CABB instantaneous bandwidth: 2 x 2GHz (full Stokes) 16-fold increased in bandwidth! 4-fold increase in continuum sensitivity CABB’s increased sensitivity has substantially advanced the science capabilities of the ATCA!
CO(1-0) in F00183 Measuring the reservoir of molecular gas in F00183 will enable us to estimate the contribution by star-formation of the overall energy budget without contamination of AGN If all the IR luminosity were due to star-formation we would expect an extremely strong CO(1-0) detection…
CO(1-0) in F00183 • 2 x 2 GHz, 1 MHz resolution ~3.5km/s • Observing frequency: 115.271/(1+z) = 86.8 GHz • Effective on source time ~25h 4 x 12h in H75 (PI: Norris) October 2011 7.4 arcsec spatial res
CO(1-0) in F00183 Peak: 6.3 mJy / beam Velocity shift: 305 km/s FWHM: 297 km/s
CO(1-0) in F00183 Spatially unresolved L’CO = 1.25 x 10¹⁰ K km/s pc2 MH2 = 1 x 10¹⁰ M (αX = 0.8 M, Downes & Solomon 1998) Implies SFR ~220 M/year (e.g. Carilli & Walter 2013)
Huge-normous star-formation? L8-1000μm = 9 x 10¹² L (Spoon et al. 2009) If powered solely by star-formation this would imply a SFR of ~1600 M/year! L2-10keV ~ 2 x 1044 erg/s (Nandra & Iwasawa 2007) If powered solely by star-formation this would imply a SFR of >12000 M/year!
But there’s a whopping great AGN… Norris et al. (2012) find a 1025 W/Hz AGN core Nandra & Iwasawa (2007) calculate that the AGN contributes >80% of the total IR luminosity Ranalli et al. (2003) infer the SFR from the soft X-ray luminosity to be 310 M/year Spoon et al. (2004) find that star-formation contributes only up to 30% of the total IR luminosity…
Consistent-ishSFRs • Despite the extremely high infrared luminosity, near and mid-IR diagnostics suggest that no more than 30% is due to star-formation • <30% of 9 x 10¹² L=~<3 x 10¹² L SFR ~<540 M/year • Recall that this is an upper limit • X-ray diagnostics suggest the SFR is ~310 M/year • The CO luminosity we derive from our ATCA observations suggest the SFR is 220 M/year • F00183 is still very star-bursty but no longer super insanely so…
Meanwhile, we got a better optical image What is this?
Meanwhile, we got a better optical image Is there star-formation here?
Radio Continuum from Star-Formation We know that the radio emission from the AGN will be unresolved with the 6km ATCA Thus any detection of resolved structure will be tracing star-formation
Radio Continuum from Star-Formation If we assume ~30% of the IR luminosity is due to star-formation, then using the FIR/radio correlation we can guesstimate the amount of star-formation we would expect to see in the radio S70μm = 1.5 Jy ~0.5Jy from star-formation Using q70 = 2.15 (Appleton et al. 2004), we would then expect to detect 3.5mJy at 1.4GHz α= -0.97 between 1.4 and 8.6GHz (Drake et al. 2004) Expect to detect ~600uJy at 9GHz due to star-formation
Radio Continuum from Star-Formation • 3 x 12h in 6A • 2 x 2 GHz centred at 6 and 9.5GHz • ~1 arcsec resolution • ~10 beams across the source • Requires sensitive, high dynamic range imaging to combat the bright AGN core!
The final 6GHz image had a dynamic range of ~17000, but there are still artefacts around the central source!
Focus issues and high dynamic range • This project was the first project to use the full array with the 4cm system – since then the focus positions have been refined After much angst and expert advice, the current prognosis by ATCA staff is that this is due to the 4cm receiver positions not being well known and hence the radio images are ‘out of focus’
Radio Continuum from Star-Formation We do not detect any evidence for star-formation in the extension seen in the optical image Radio flux density < 0.1mJy/beam SFR < ~30 M/year Not terribly exciting… The unresolved radio detection suggests that the star-formation that we expect to see is likely nuclear Lack of extended radio emission rules out vast amounts of star-formation occurring outside of the nucleus…