Download

1 / 27
270 likes | 281 Views
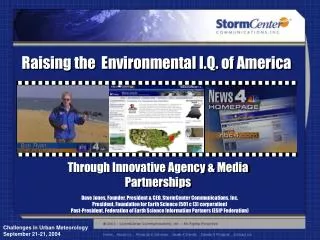
Science Made Simple. “By turning massive amounts of data into pictures, which are easy to understand, we make information radically obvious .". Andrew Cardno President, CEO and founder BSurv, Dip Comp Sci of Compudigm International.

E N D
Science Made Simple • “By turning massive amounts • of data into pictures, which are easy to understand, we make informationradically obvious." Andrew Cardno President, CEO and founder BSurv, Dip Comp Sci of Compudigm International “Click” on the button to start the presentation”and ”Esc” to finish - Page up and down to go through
“Click” on the map once to start and again to stop Would you like to easily understand “who” prefers to play “what” games and “when” in just seconds?
Would you like to easily measure the effectiveness of advertising and target marketing programs? Measure Marketing Programs “Click” on the map once to start and again to stop Here you can see the results of ‘the bus program promotion’ to selected zip code areas.
“Click” on the map once to start and again to stop • Would you like to easily understand “where” your customers come from and at “what” time of the day they play in just seconds?
Eliminate Spreadsheets • Are you satisfied with: • your current reports with regard to the performance of the casino floor? • your customer loyalty program reports? • the timeliness of the reports?
seePOWER Components 1. Visualizer (Maps) 2. Profiler (Marketing) 3. Planner (Floor Changes)
Visualizer - See all opportunities Game Placement? • By visualizing the performance data as a “Big Picture” you can quickly & easily identify major revenue opportunities that would easily be missed with traditional spreadsheet reporting. Non Jackpot Noticing and acting upon these opportunities increased the Coin In (Handle) this room by more than $160,000 per day! With a Jackpot Manufacturer placement?
Visualizer - Click to Drill Down • Simply Zoom In then “click” on an area or slot of interest and “Drill Down” to easily see all the data. • Discover quickly and take action based on fast accurate facts.
Visualizer - Measure Changes • See the results of floor changes easily and as soon as the next day. Replicate the positive changes and correct the negative changes. Before After
Profiler - Marketing made easy seePOWER Profiler enables you to identify and monitor your most valuable customers throughout their life cycle. Marketing can easily create fast mailing lists. Know “what” promotional offer to send to “which” customer.
Visualize Profiles (Female play) • Linking your customers to your product. • See who plays where, what and when.
Visualize Profiles (Male play) • Linking your customers to your product. • See who plays where, what and when.
Planner - Floor Changes • Easily manage your floor layout changes whilst keeping a history of previous layouts for important reference.
seePOWER Architecture Rapid Delivery, Proven Industry Solution Disseminate Windows, Intranet Visualizer, Profiler, Drilldown Visualize Sybase IQM Hardware Planner Store Data Catalog (Key Performance Indicators) KPI’s Data Model Capture Slots Tables Hotel F&B Internet POS Other Support & RnD 24*7 Support 5 Year RnD Program
Visualize BEFORE Mining Visualization is the missing link between data and decision makers • Mining - takes a small sample of data and draws conclusions on the whole • Visualization - interrogates all of the data to pinpoint areas of interest for interrogation by mining tools • Getting insights 80% faster gives you 80% more quality timefor business improvement actions
Awards & Achievements “Leading the world” 1st place in the Datawarehousing Institute’s Pioneering Products Shootout Named a Smithsonian Laureate by the US Computerworld for our revolutionary excellence.
seePOWER Gaming Customers These are our recent seePOWER gaming industry customers : Crown Casino, Australia Parramatta Leagues Club, Australia Park Place Australia (2x Conrad’s Casinos) Hard Rock Hotel & Casino, USA Harrah’s Entertainment, USA (Including 4 Indian Casinos)
What people are saying “... seePOWER will enable Harrah's to more easily determine the most popular slot products for our players by displaying the flow of traffic and revenues across the casino floor. Providing the right slots at the right places to our customers is just one more way we expect to continue to grow our revenues." John Boushy, Harrah's Entertainment Senior Vice President of Operations Products and Services and CIO “seePOWER is a very easy software tool to use - it provides us with instant information about our slot performance right across the floor and delivers dramatic increases in profitability.” Clayton Wheeler, Slots Manager, Crown Casino “seePOWER is a new paradigm in helping business get value from their data . . . It is two generations ahead of anything else on the market.” Frank Teklitz, Product Manager, Sybase “Compudigm (TDWI winner) visualization techniques can definitely help a business succeed. I found their solution innovative and a definite part of a corporate information factory” Joyce Norris-Montanari, VP Braun Consulting and The Data Warehousing Institute Judge "We are proud to be associated with seePOWER”Tom Baker, President and CEO of IGT. “If you own a casino, get seePOWER.” Chris Forsyth, Executive Editor, Sybase
Proven ROI and Benefits • seePOWER solution is installed into • Kerry Packer’s Crown Casino in Australia and has contributed to the increase in profitability by A$25 million p/a • which equates to a two month payback • By using seePOWER effectively you will have the ability to: • Increase your EBITDA Contribution by an average of 10% • Further increase your customer base and their loyalty • Further maximize your Product Mix and Real Estate • Increase enterprize productivity and accountability • Gain that competitive advantage
seePOWERTable Games Additional Modules Rapidly understand table game player behaviors by profile, thus increasing your competitive advantage. Increase table game player’s spend and visitation through better targeted marketing campaigns. Maximize table game mix and placement. Understand where your table game players come from and when they play. Understand what happens to the table game floor performance after events or at certain times of the day.
seePOWERHotel Additional Modules Understand the entire Hotel occupancy for the year/month/week/day in under a minute. Understand the effects of conferences & events throughout the year on occupancy. Measure the success of marketing campaigns. Learn table game player occupancy patterns. Learn slot player occupancy patterns. Combining Table Game and Slot data to understand where your regular Slot customers play, when playing table games.
seePOWER Hotel Occupancy Instantly you can identify all the possible reasons behind the high and low occupancy rates for the entire hotel for an entire year. Or see when your Table Game and/or Slot players stay by profile (age, gender, spend or visits).