Download
1 / 22
230 likes | 560 Views
The What and the Why of Statistics. The Research Process Asking a Research Question The Role of Theory Formulating the Hypotheses Independent & Dependent Variables: Causality Independent & Dependent Variables: Guidelines Collecting Data Levels of Measurement

E N D
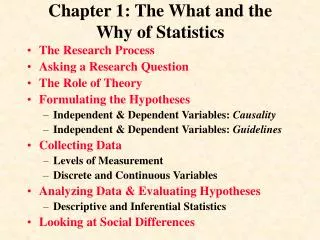
The What and the Why of Statistics • The Research Process • Asking a Research Question • The Role of Theory • Formulating the Hypotheses • Independent & Dependent Variables: Causality • Independent & Dependent Variables: Guidelines • Collecting Data • Levels of Measurement • Discrete and Continuous Variables • Analyzing Data & Evaluating Hypotheses • Descriptive and Inferential Statistics
The Research Process Examine a social relationship, study the relevant literature Formulating the Hypotheses Asking the Research Question Contribute new evidence to literature and begin again Develop a research design THEORY Collecting Data Evaluating the Hypotheses Analyzing Data
Asking a Research Question What is Empirical Research? • Research based on information that can be verified by using our direct experience. • To answer research questions we cannot rely on reasoning, speculation, moral judgment, or subjective preference • Empirical: • “Are women paid less than men for the same types of work?” • Not Empirical: • “Is racial equality good for society?”
The Role of Theory • A theory is an explanation of the relationship between two or more observable attributes of individuals or group. • Social scientists use theory to attempt to establish a link between what we observe (the data) and our understanding of why certain phenomena are related to each other in a particular way.
Formulating the Hypotheses • Hypotheses: • Tentative answers to research questions (subject to empirical verification) • A statement of a relationship between characteristics that vary (variables) • Variable: • A property of people or objects that takes on two or more values • Must include categories that are both exhaustive and mutually exclusive
Units of Analysis The level of social life on which social scientists focus (individuals, groups). Examples: • Individual as unit of analysis: • What are your political views? • Family as unit of analysis: • Who does the housework? • Organization as unit of analysis: • What is the gender composition? • City as unit of analysis: • What was the crime rate last year?
Types of Variables • DependentThe variable to be explained (the “effect”). • Independent The variable expected to account for (the “cause” of) the dependent variable. IV DV
Cause and Effect Relationships Cause and effect relationships between variables are not easy to infer in the social sciences. Causal relationships must meet three conditions: • The cause has to precede the effect in time. • There has to be an empirical relationship between the cause and effect. • This relationship cannot be explained by other factors.
Guidelines for Independent and Dependent Variables • The dependent variable is always the property you are trying to explain; it is always the object of the research. • The independent variable usually occurs earlier in time than the dependent variables. • The independent variable is often seen as influencing, directly or indirectly, the dependent variable.
Example 1 People who attend church regularly are more likely to oppose abortion than people who do not attend church regularly. • Identify the IV and DV • independent variable: church attendance • dependent variable: position on abortion • Identify possible control variables • gender – age • religious affiliation (Catholic, Baptist, Islamic…) • political party identification • Are the causal arguments sound? • e.g. does party id affect abortion views or vice versa?
Example 2 The number of books read to a child per day positively affects a child’s word recognition. • Identify the IV and DV • independent variable: books read • dependent variable: child’s word recognition • Identify possible control variables • gender – older siblings • health status – birth order • Are the causal arguments sound? • Most likely. It is hard to construct an argument where a 36 month old child affects the number of books his or her parent reads to him/her.
Collecting Data Examine a social relationship, study the relevant literature Formulating the Hypotheses Ask the Research Question Contribute new evidence to literature and begin again Develop a research design THEORY Collecting Data Evaluating the Hypotheses Analyzing Data
Collecting Data • Researchers must decide: • How to measure the variables of interest • How to select the cases for the research • What kind of data collection techniques to use
Levels of Measurement Not every statistical operation can be used with every variable. The type of statistical operations we employ will depend on how our variables are measured. • Nominal • Ordinal • Interval-Ratio
Nominal Level of Measurement Numbers or other symbols are assigned to a set of categories for the purpose of naming, labeling, or classifying the observations. • Examples: • Political Party (Democrat, Republican) • Religion (Catholic, Jewish, Muslim, Protestant) • Race (African American, Latino, Native American)
Ordinal Level of Measurement Nominal variables that can be ranked from low to high. • Example: Social Class • Upper Class • Middle Class • Working Class
Interval-Ratio Level of Measurement Variables where measurements for all cases are expressed in the same units. (Variables with a natural zero point, such as height and weight, are called ratio variables.) • Examples: • Age • Income • SAT scores
Cumulative Property of Levels of Measurement • Variables that can be measured at the interval-ratio level of measurement can also be measured at the ordinal and nominal levels. • Properties that can be measured at a higher level (interval-ratio is the highest) can also be measured at lower levels, but not vice versa.
Discrete and Continuous Variables • Discrete variables: variables that have a minimum-sized unit of measurement, which cannot be sub-divided • Example: the number children per family • Continuous variables: variables that, in theory, can take on all possible numerical values in a given interval • Example: length
Analyzing Data: Descriptive and Inferential Statistics • Population: The total set of individuals, objects, groups, or events in which the researcher is interested. • Sample: A relatively small subset selected from a population. • Descriptive statistics: Procedures that help us organize and describe data collected from either a sample or a population. • Inferential statistics: The logic and procedures concerned with making predictions or inferences about a population from observations and analyses of a sample.
Analyze Data & Evaluate Hypotheses Examine a social relationship, study the relevant literature Formulating the Hypotheses Asking the Research Question Contribute new evidence to literature and begin again Develop a research design THEORY Collecting Data Evaluating the Hypotheses Analyzing Data
Begin the Process Again... Examine a social relationship, study the relevant literature Formulating the Hypotheses Asking the Research Question Contribute new evidence to literature and begin again Develop a research design THEORY Collecting Data Evaluating the Hypotheses Analyzing Data